Sending performance counters to Azure Monitor Metrics.
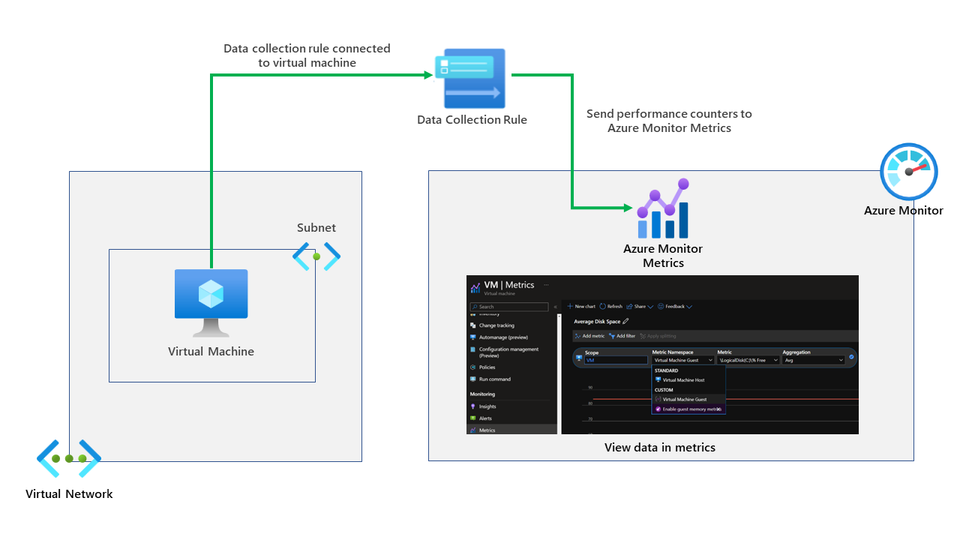
Using the Azure Monitor Agent and configuring a data collection rule to send performance counters to Azure Monitor Metrics allows you to collect performance counters from the guest operating system that runs as part of a virtual machine.
This allows counters to be directly sent to the Azure Monitor metrics store, where standard platform metrics are already collected. You can access the same tools available for platform metrics by storing them in this location.
This feature is excellent when platform metrics are not enough and platform metrics are not providing the correct performance counters. A good example used in this blog is disk space percentage which isn't collected through the platform.
Another reason you may want to use this instead of sending performance counter logs to Azure Monitor Logs (A log analytics workspace) are you don't have to query a workspace with KQL to get this information; however, KQL is excellent, sometimes administrators may want to view the metrics directly.
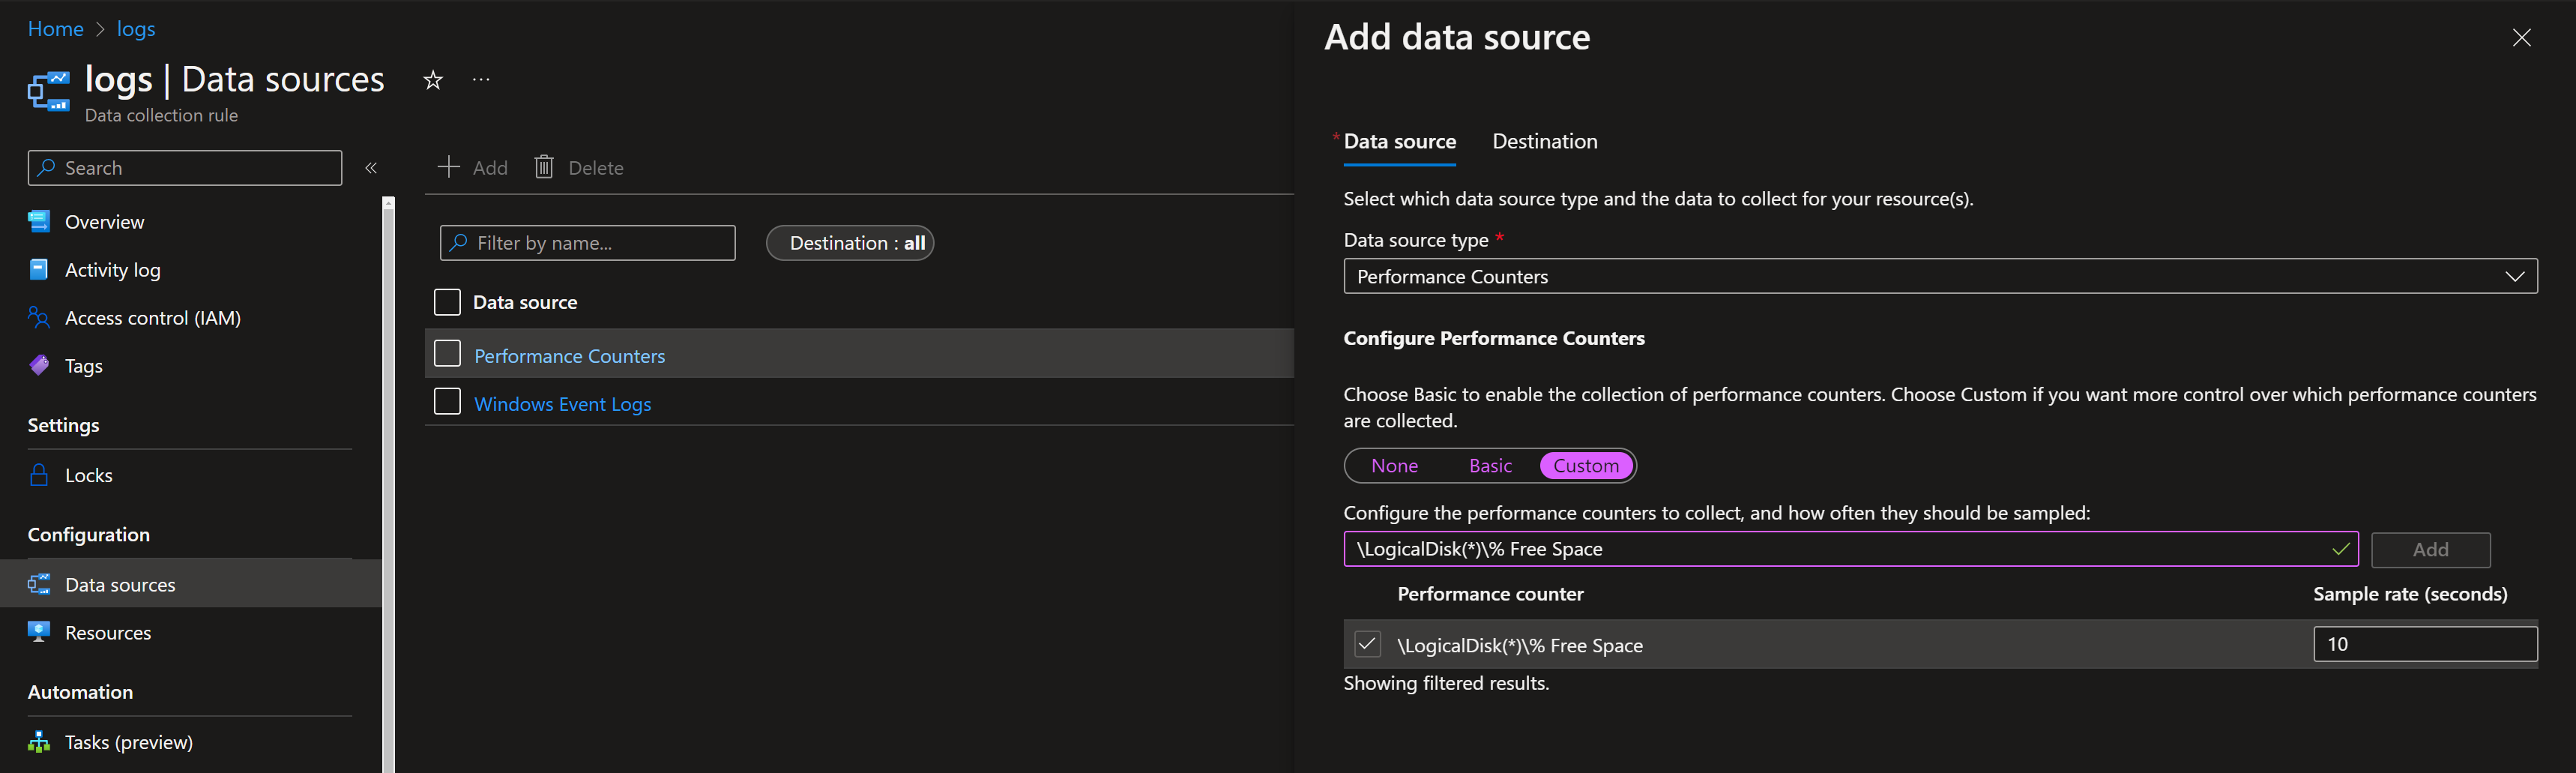
So to enable this, you need to deploy the AMA (Azure Monitor Agent) and assign a data collection rule to the resource (virtual machine), so the agent is configured to send the data to the metrics store; in our example, we shall configure the agent to collect performance counters for \LogicalDisk(*)% Free Space which should provide us information around how much space in percentage is available on a logical disk.
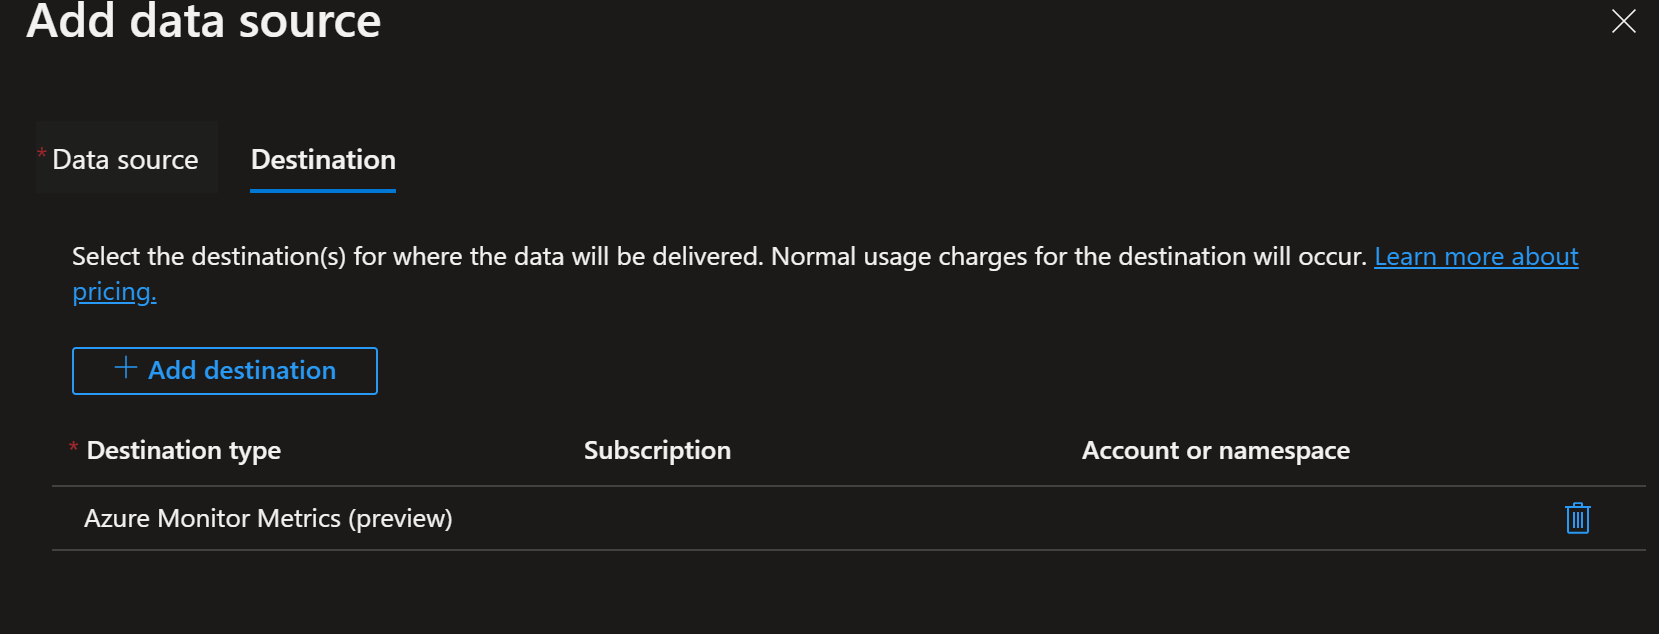
Ensure you set the destination to Azure Monitor Metrics (Preview).
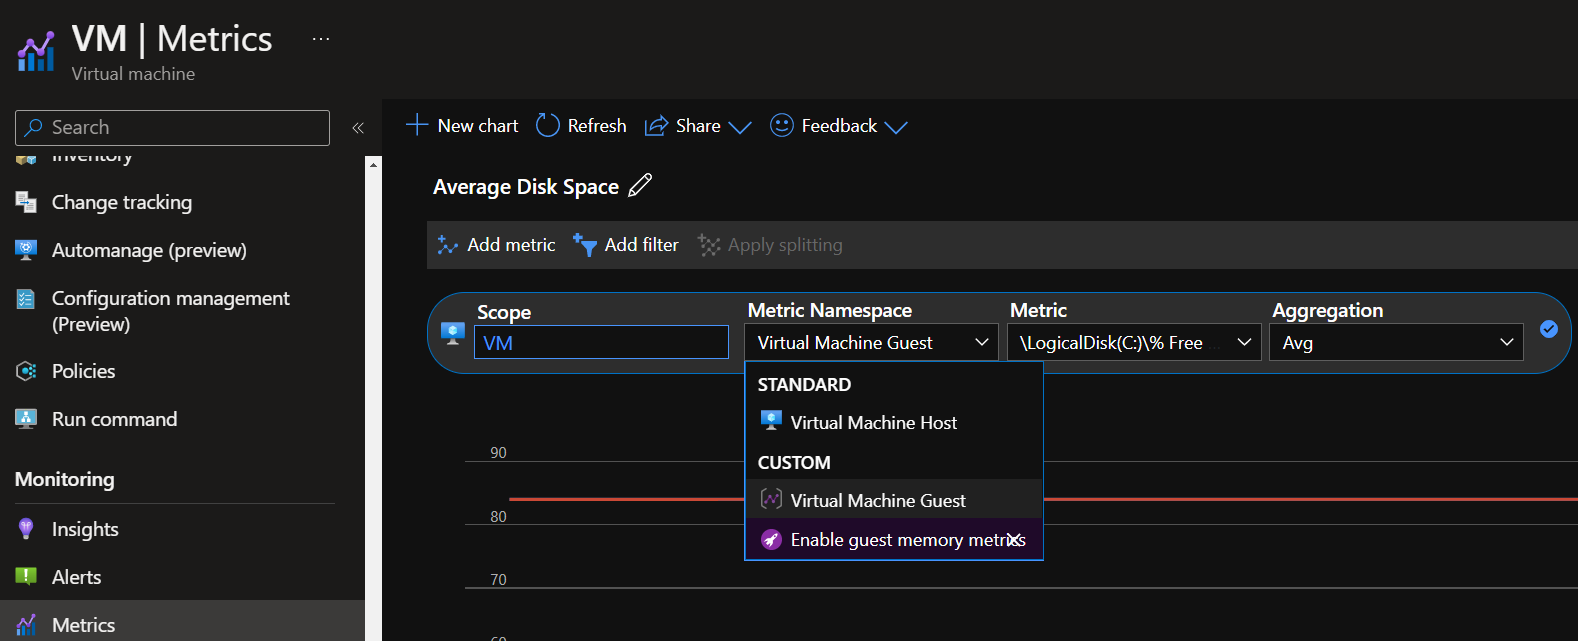
Once this is done, the performance counters should be collected from the guest operating system via the AMA and sent to the Azure Monitor metric store. To confirm this, we can go to the virtual machine and head over to the metrics blade; we should now be able to view the logic disks for this virtual machine.
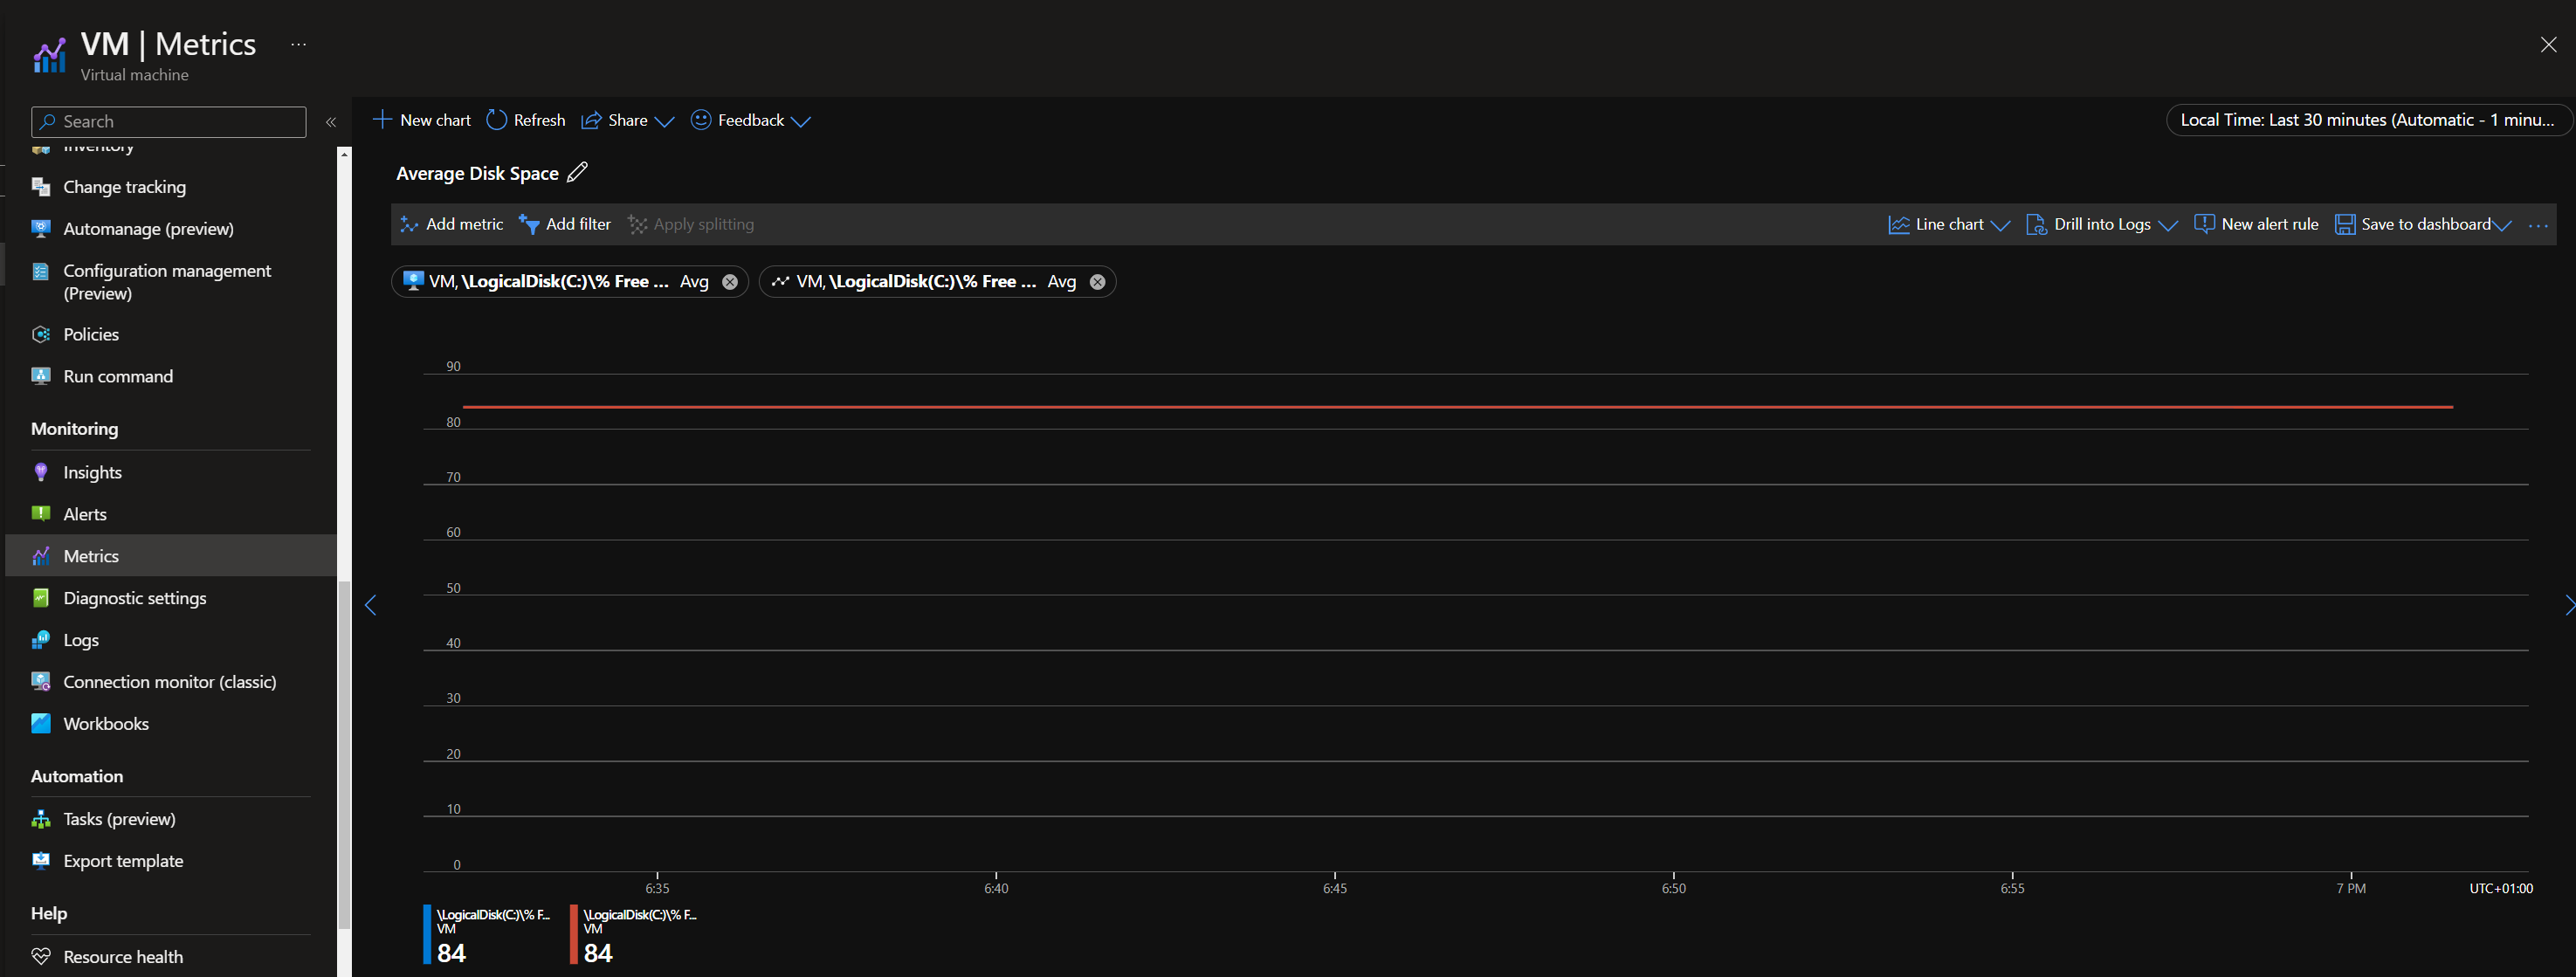
From the screenshot, you can see that we have added two metrics as logical disks are being broken down on how many disks you have on the virtual machine; in our example, we have the OS disk C: and a data disk running on D:
It's also important to note you will need to change the metric namespace from virtual machine host to virtual machine guest when viewing the metrics.
As this information can now be viewed in Azure Monitor Metrics, let's download some files to reduce the percentage of free space on the C:\ drive.
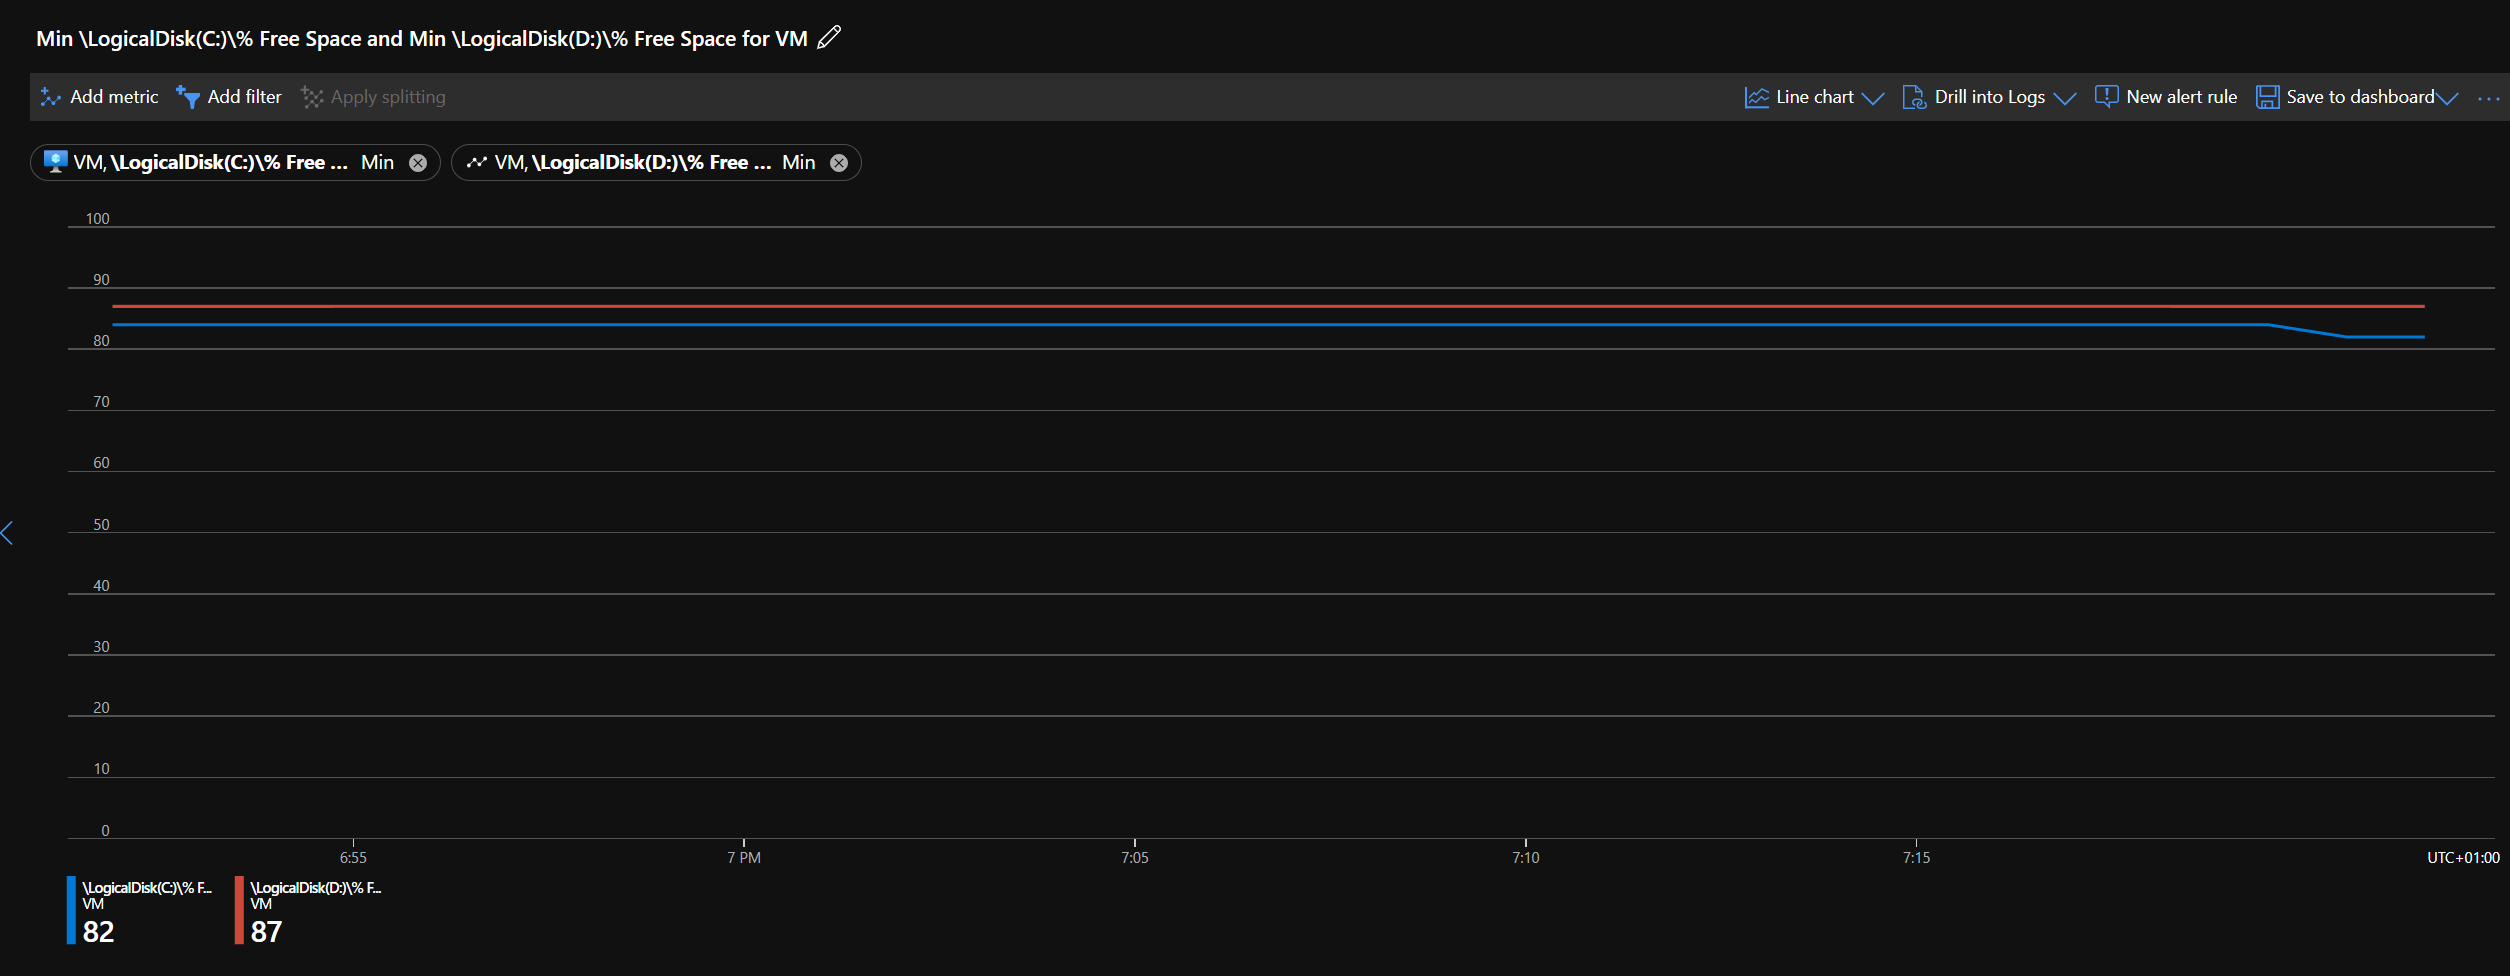
Instantly we can see the data coming into Metrics. We could do some further configuration around alerts when the percentage gets lower than 10%, but this was just a quick demonstration of how easy it is to set up guest OS monitoring for Azure Monitor Metrics.
As I previously mentioned, Azure Monitor Logs can also get this information if we set the DCR to send performance metrics to a Log Analytics Workspace. A simple query can be seen below, which brings the same information.
InsightsMetrics
| where Origin == "vm.azm.ms"
| where TimeGenerated >= ago(15m)
| where Namespace == "LogicalDisk" and Name == "FreeSpacePercentage"
| summarize FreeSpacePercentage = avg(Val) by Computer, _ResourceId, Tags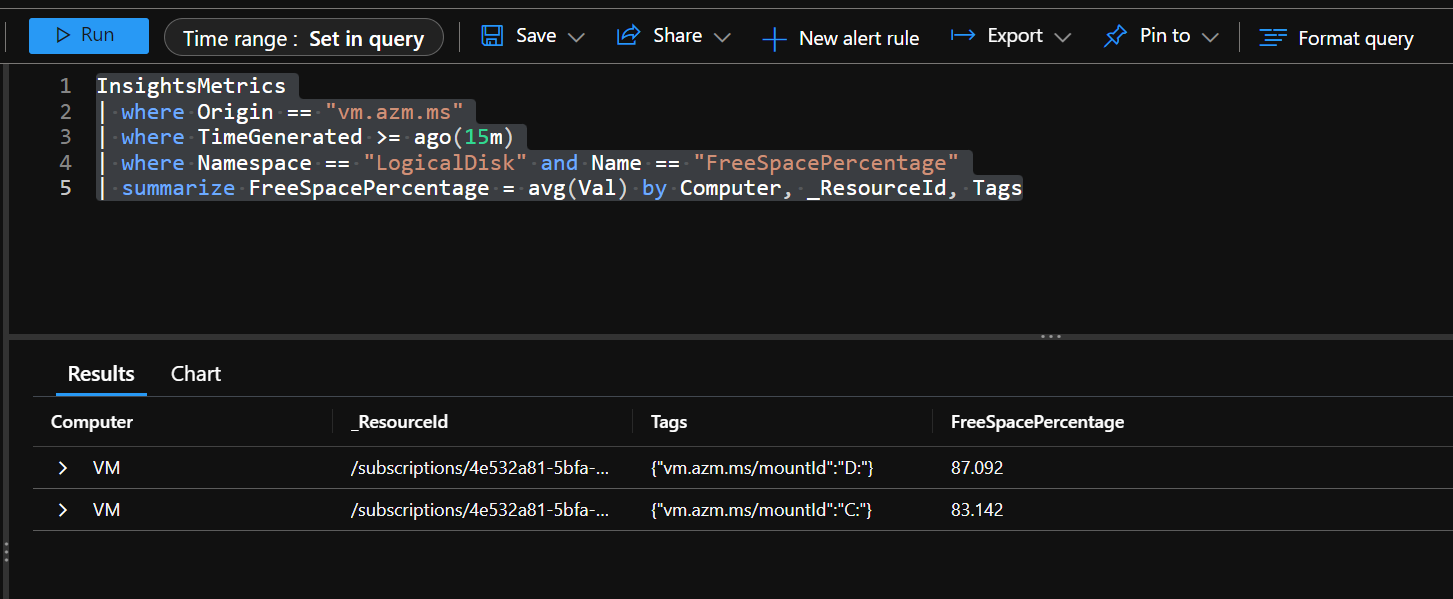
If this content was helpful, please feel free to connect with me on social media at