Looking at Azure Network Watcher
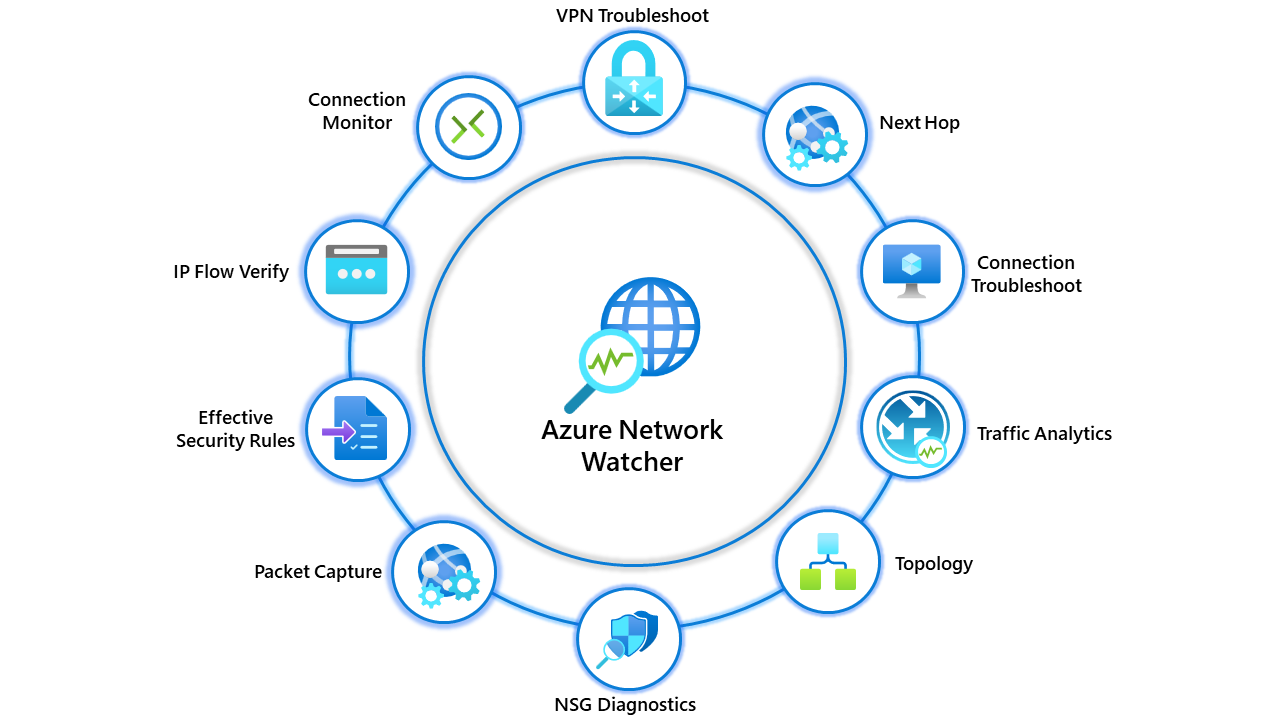
Who doesn't like a tool that helps troubleshoot networking issues? Everyone wants a hand now and then, which is precisely what Network Watcher is about.
Network watcher is just an umbrella term for multiple tools you can use. Note: I won't include legacy tools being deprecated in this blog. This includes Connection Monitor (Classic) and Network Performance Monitor.
The following tools are available to you in Network Watcher.
- Topology
- Connection Monitor
- IP Flow Verify
- NSG Diagnostics
- Effective Security Rules
- VPN Troubleshoot
- Packet capture
- Connection Troubleshoot
- Traffic Analytics
Topology
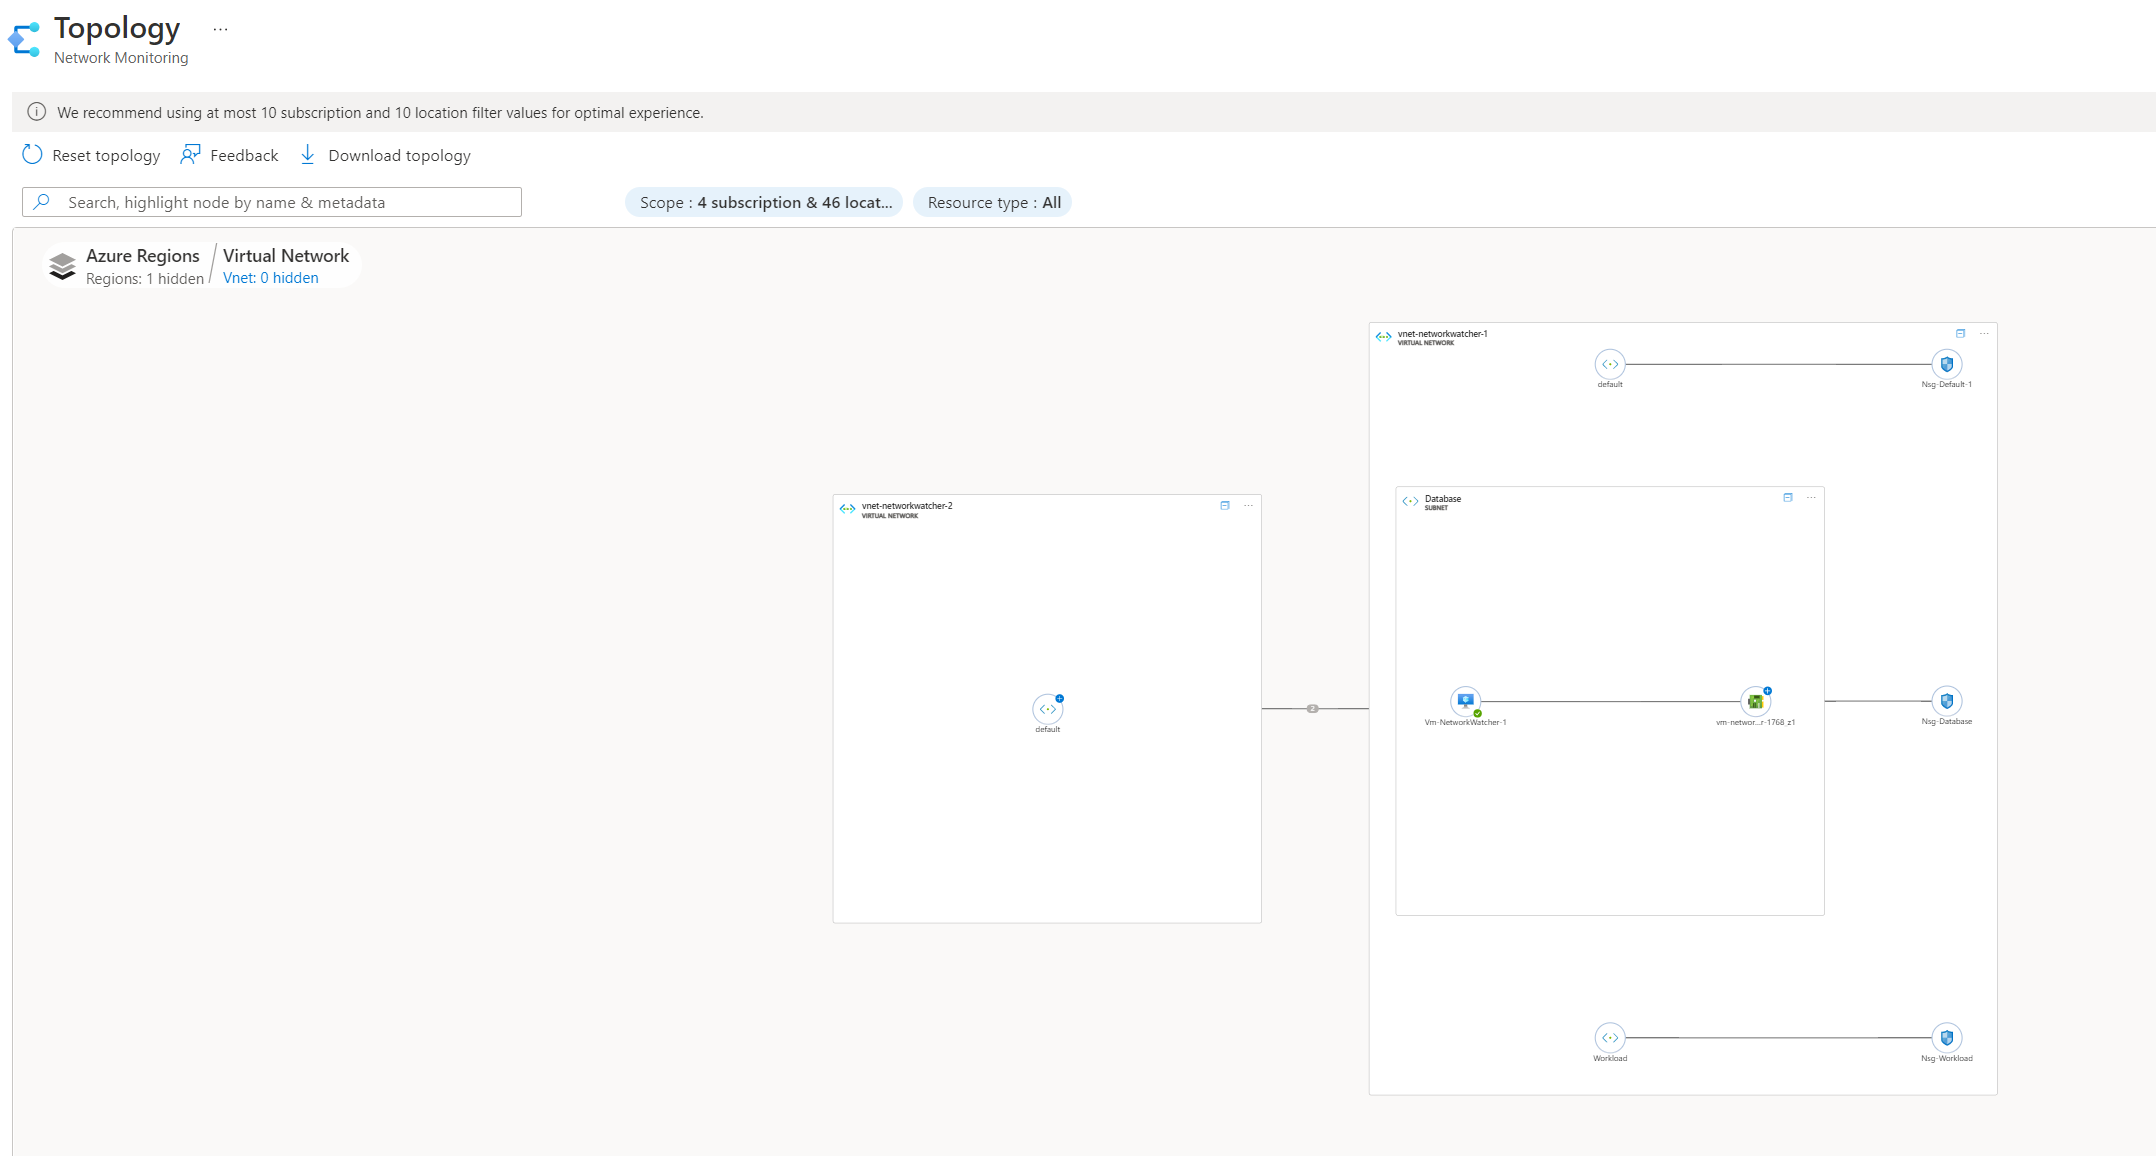
Network Watcher contains a topology tool which provides an overview of your networking environment. This can help significantly when you are new to an environment and need to see how things are connected.
The topology overview is reasonably basic but provides a good overview.
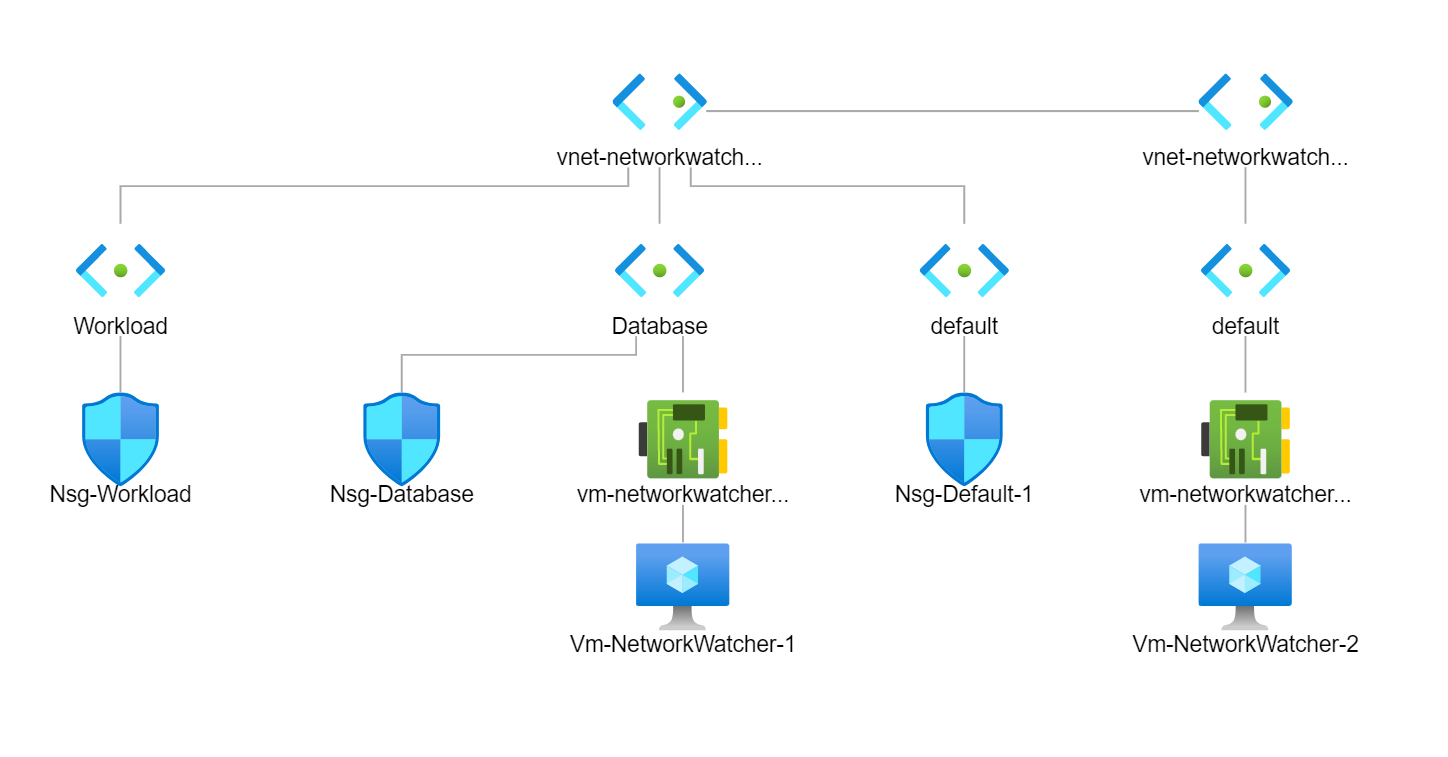
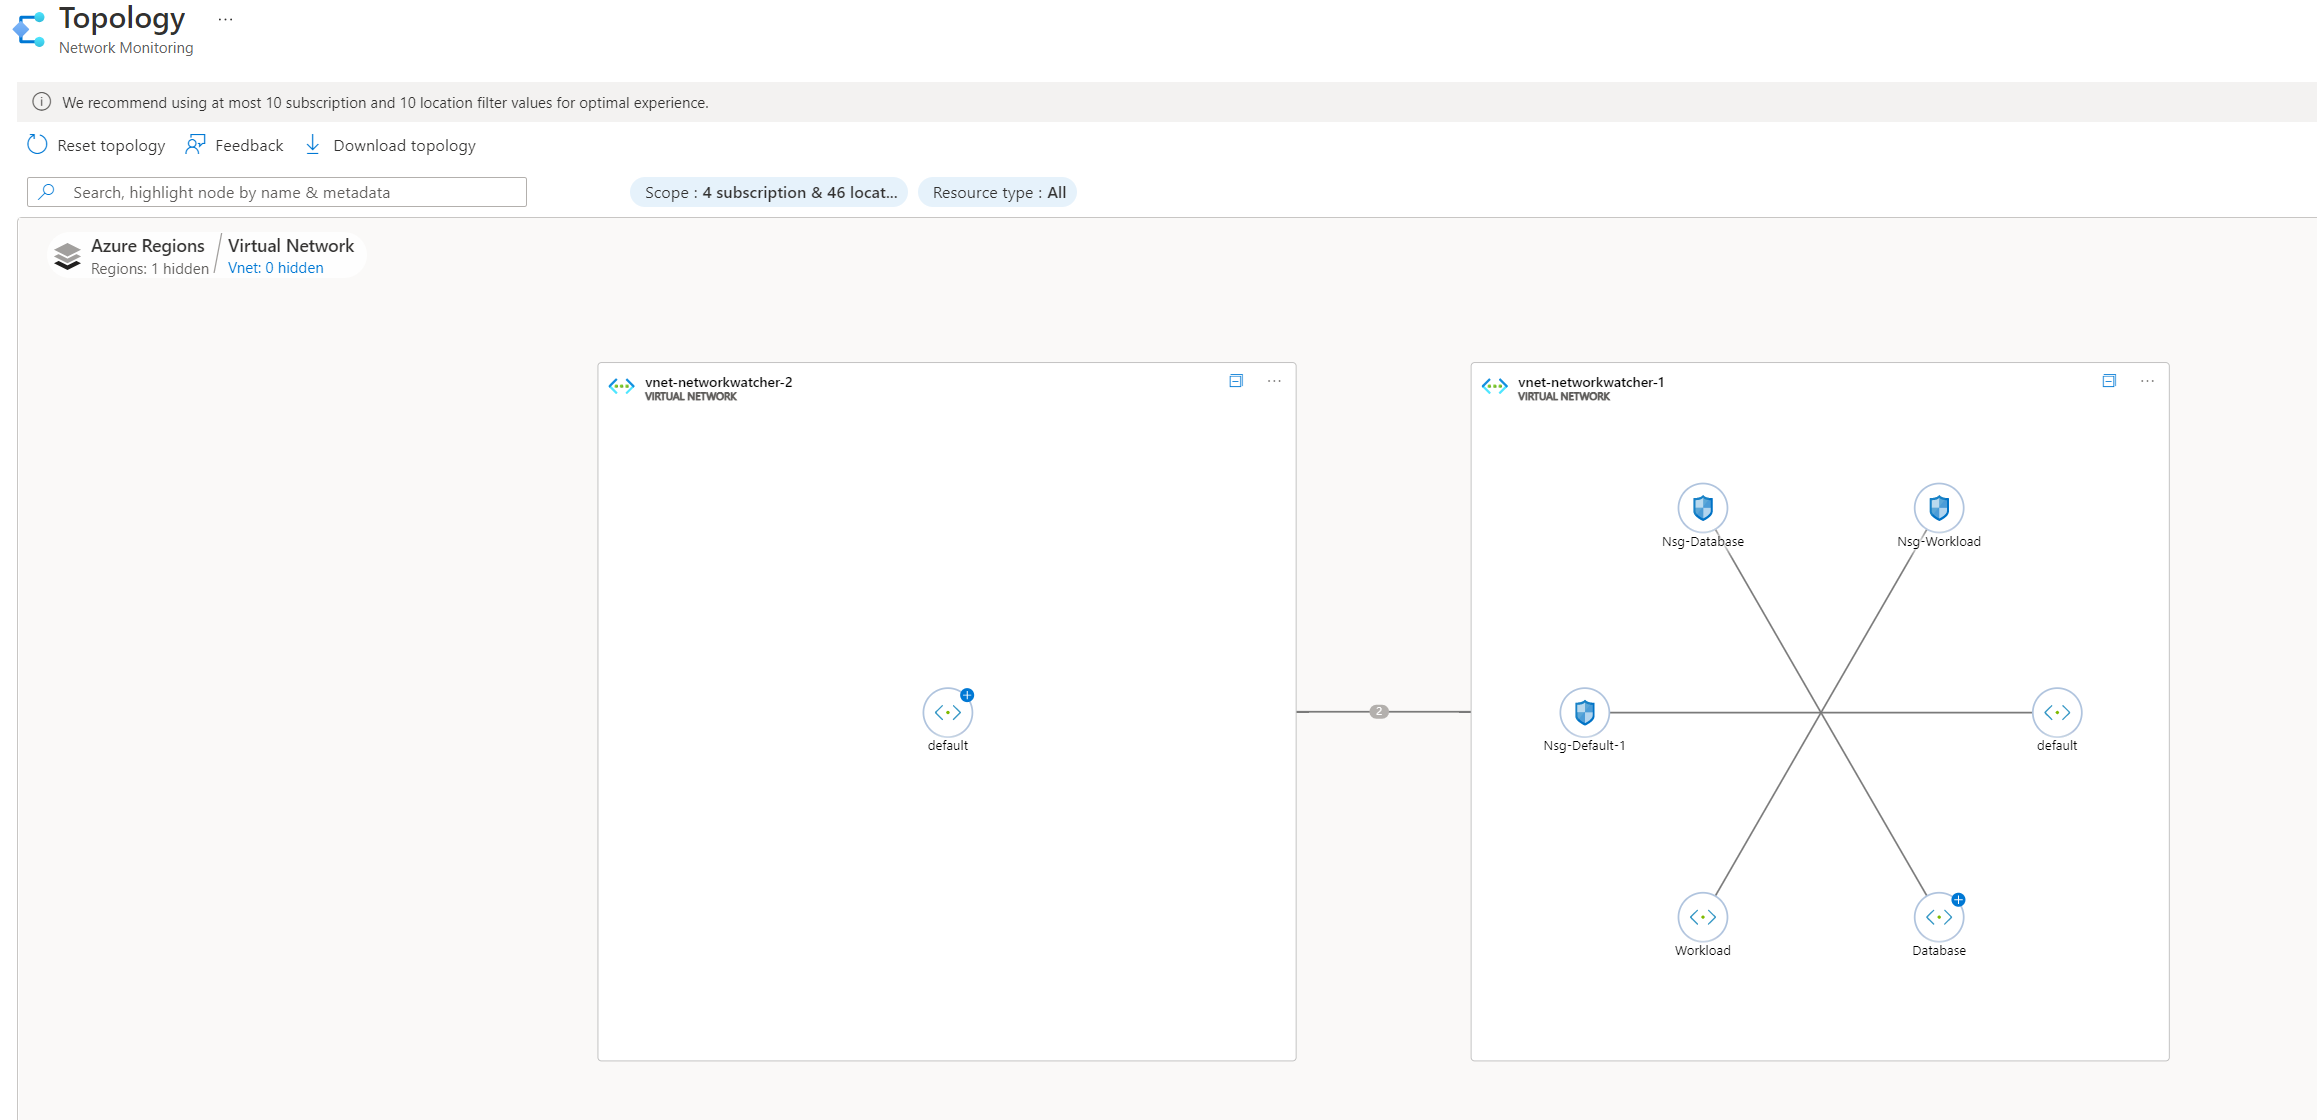
You can see how useful this can become, showing us an overview of the environment and what networking resources are being used. Depending on when you read this blog, you'll also see that topology will have a new experience in the future.
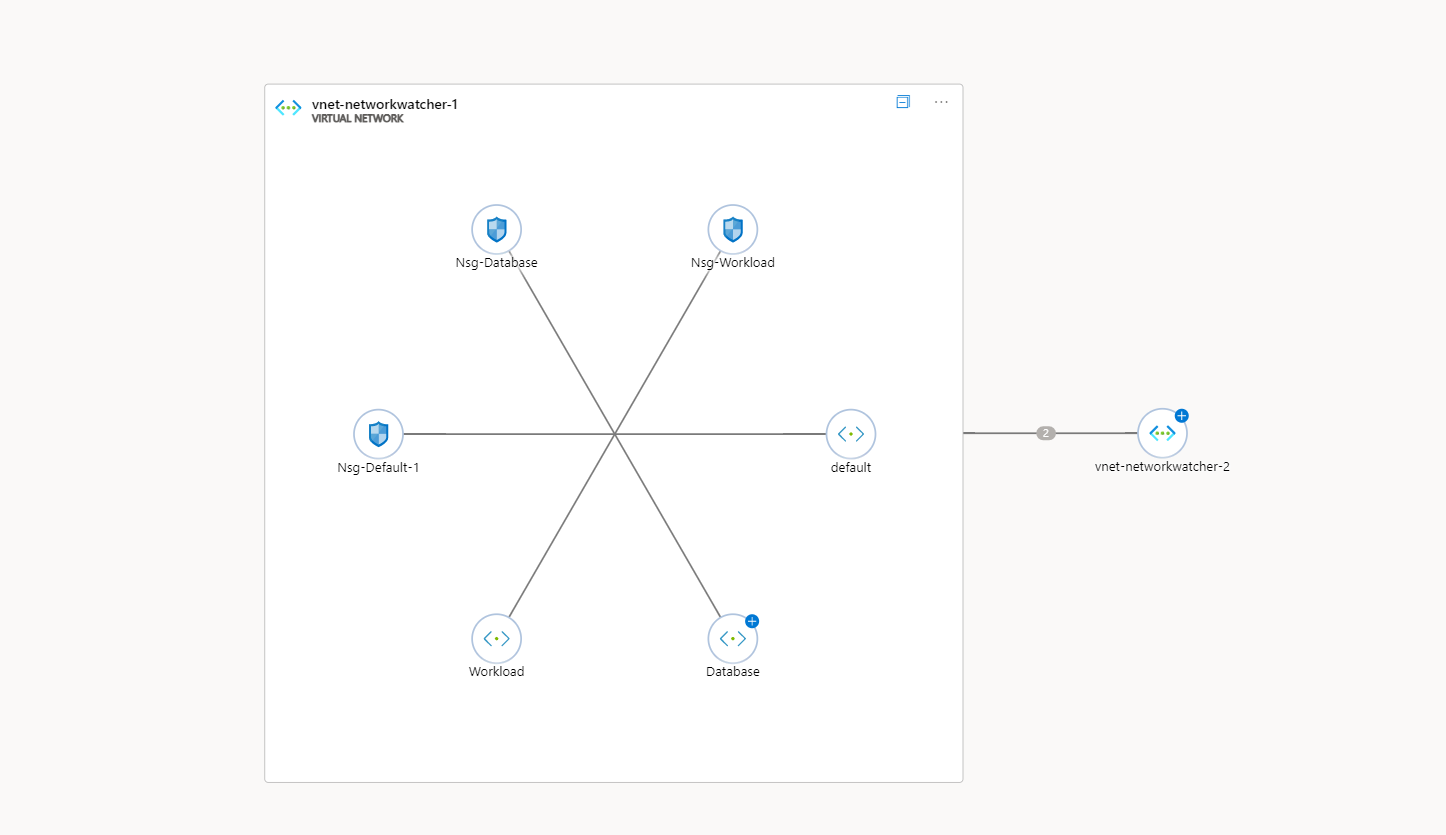
Whereas the original topology is a flat diagram, the new topology experience allows for deeper analysis as the topology diagram can be expanded on specific resources. The below screenshots show an example of powerful this can be.
Connection Monitor
Connection Monitor provides end-to-end connection monitoring, and Connection Monitor supports both cloud-only and hybrid-cloud deployments. This tool is excellent when testing connectivity to internal services, such as web applications or external endpoints, like Microsoft 365.
Let's go through deploying a Connection Monitor test and explore how it works.
Firstly, head over to Azure Network Watcher and click on Connection Monitor.
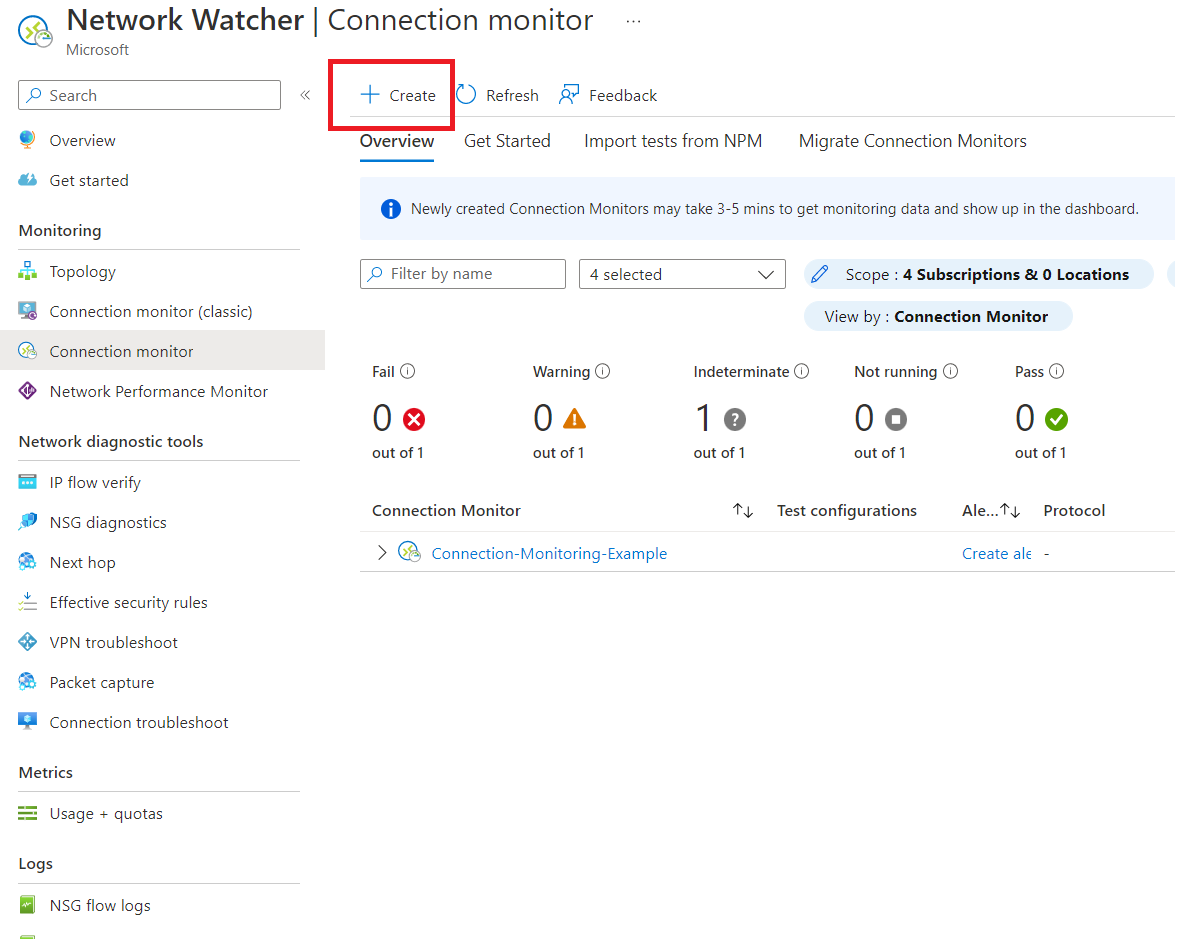
The first page will ask for standard details, such as name, region and subscription.
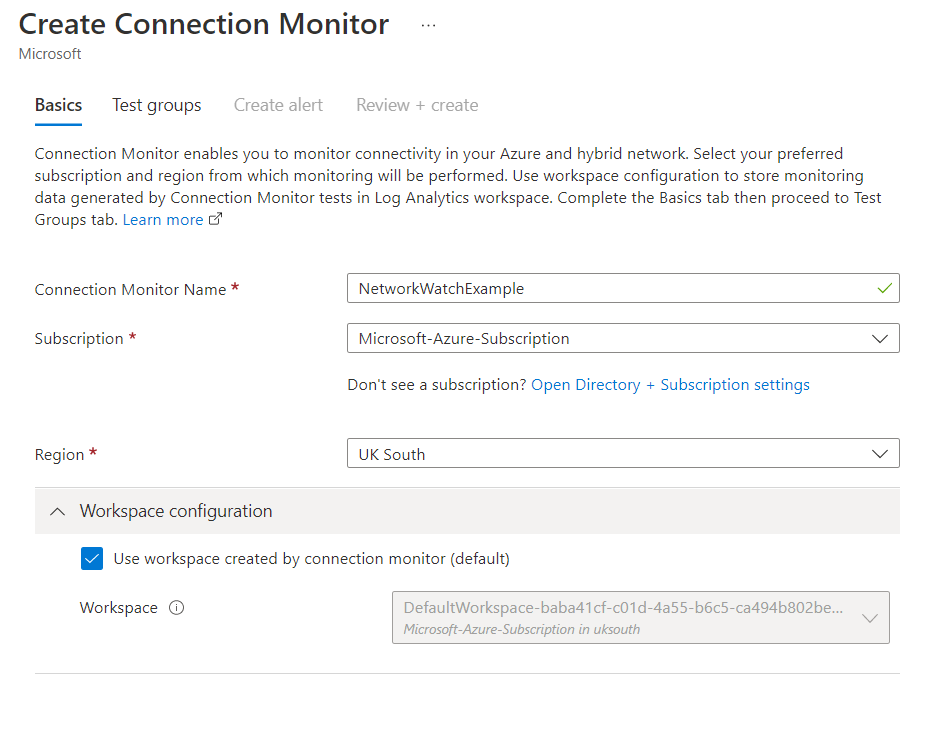
You are also asked to provide a log analytics workspace. This is because data from Connection Monitor gets ingested into a workspace. More information on this later!
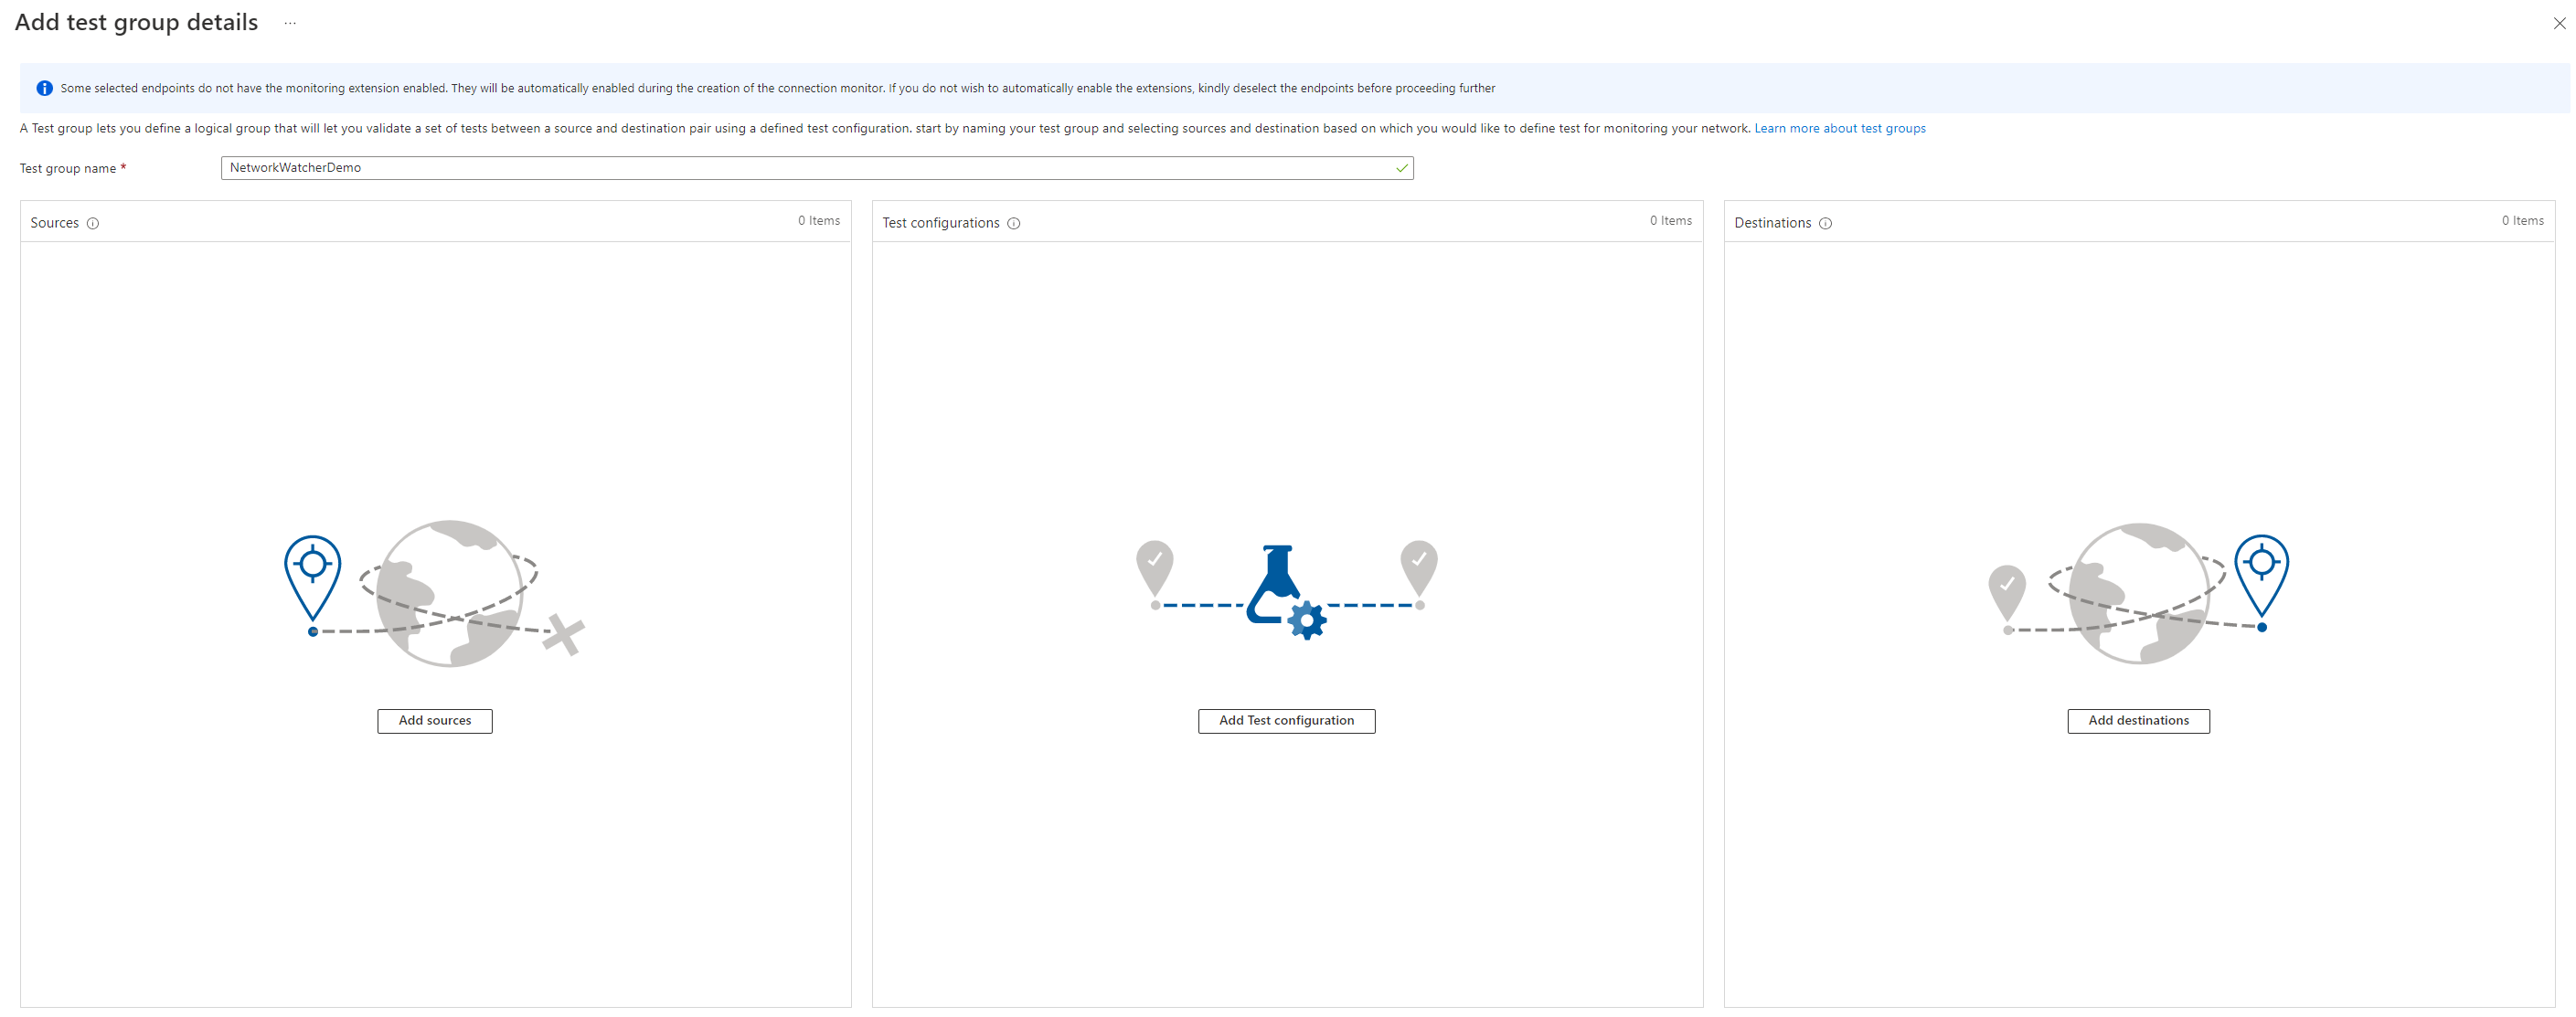
The next page is the configuration of the test group. We need a name for the group and the following information.
- Sources
- Test configurations
- Destinations
Sources
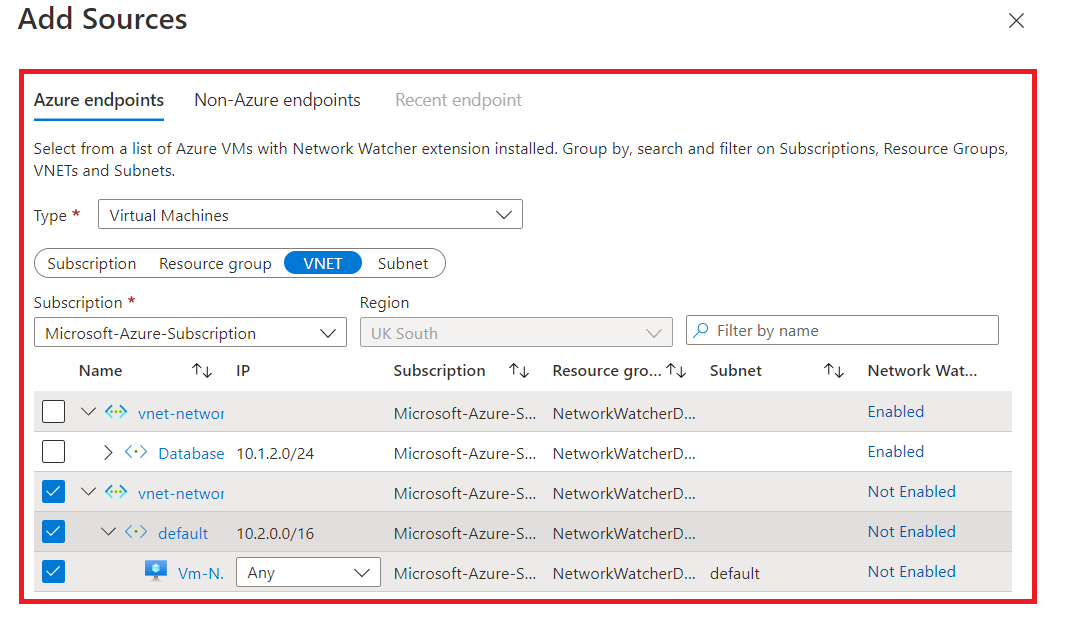
Sources can be either Azure endpoints or non-Azure endpoints. Azure endpoints are virtual machines or virtual machines scale sets running in Azure.
In contrast, non-Azure endpoints can be on-premises machines running either the Microsoft monitoring agent (MMA, legacy) or Azure Arc-enabled machines, which require the connected machine agent installed and the Azure monitor agent (AMA). This makes the connection monitor an excellent tool for Azure-only resources or hybrid clouds.
We will use an Azure virtual machine as the source in our example.
Test configurations
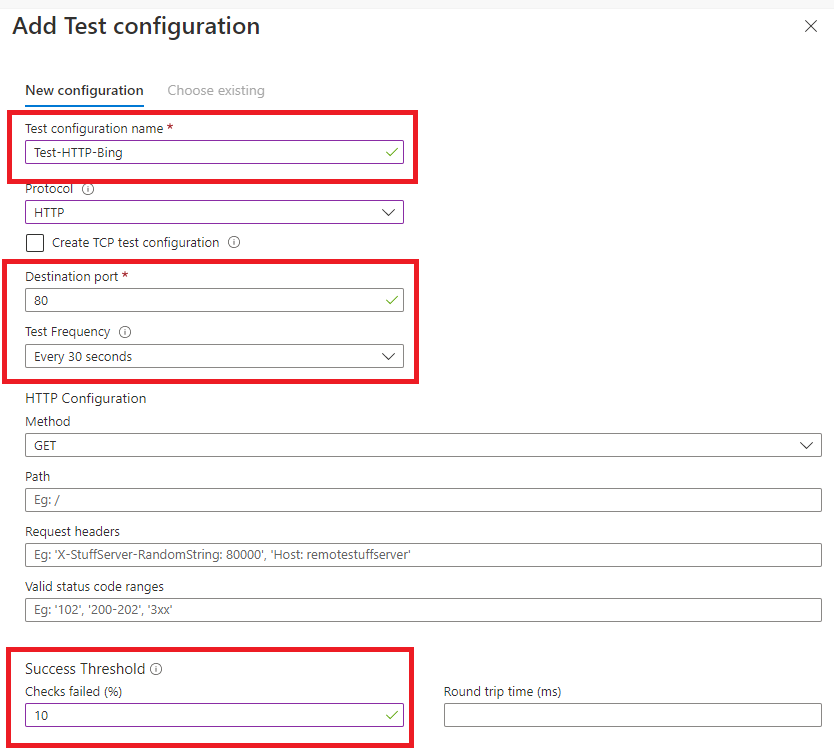
Test configurations are the next step within the connection monitor tool, where you add information about the test. This includes what protocols, ports, test frequency and what you determine as a failure.
Currently, three protocols are supported, HTTP, TCP and ICMP; depending on the protocol you select, the configuration will change. Two examples can be found below, HTTP and TCP.
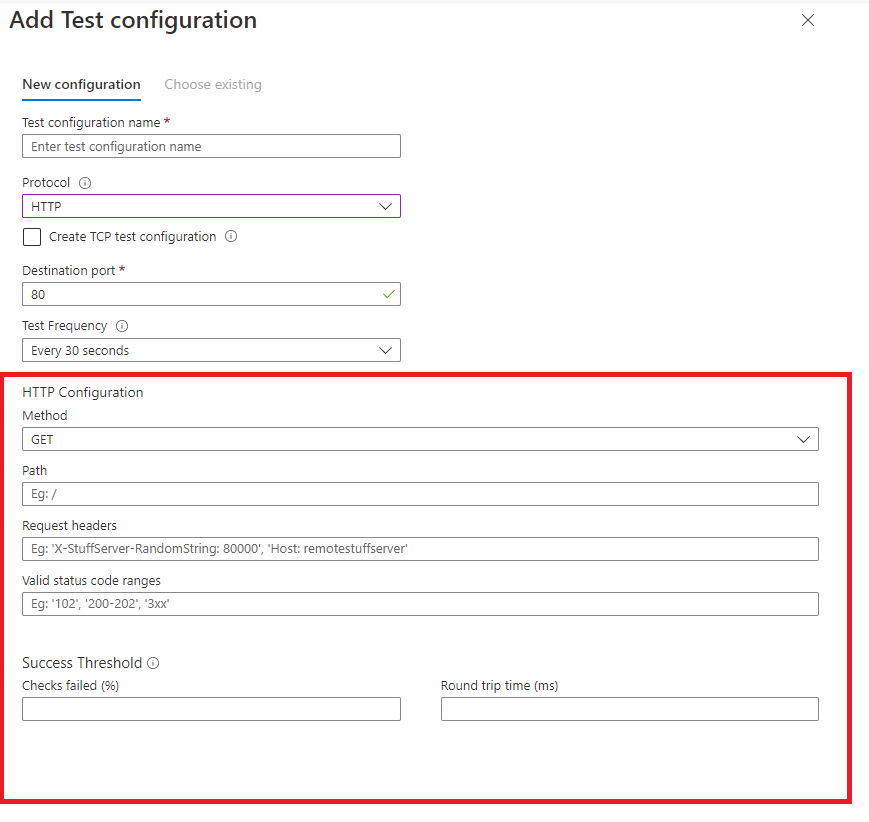
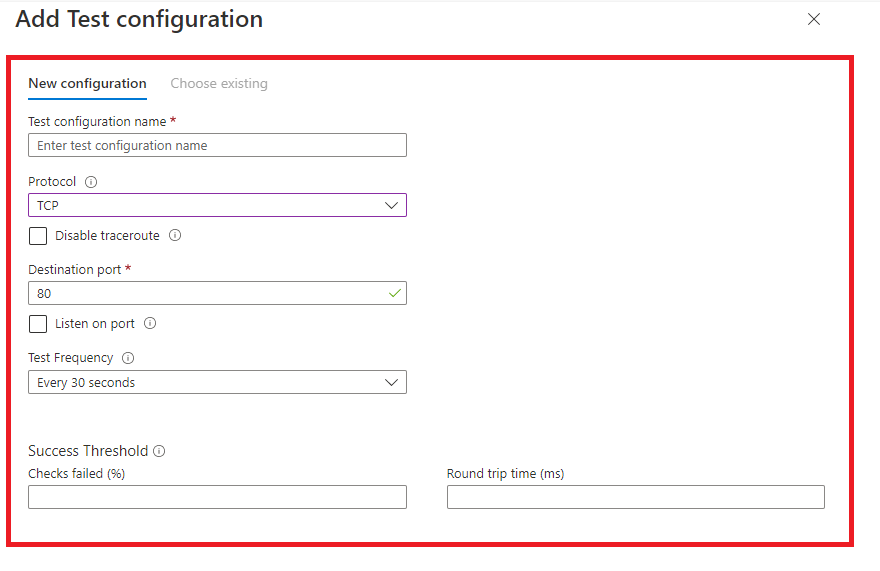
For our example, we will look at an HTTP GET test configuration. This can be seen below, which has been populated.
Destinations
The final configuration for the connection monitor tool is to determine the destination endpoints you will be testing. Thes endpoints can be the following:
- Azure Endpoints
- Non-Azure Endpoints
- External Addresses

Our example will use the External Addresses tab. When clicking on the tab, you are provided with a default list of endpoints that may be useful.
These are services that Microsoft provide, such as endpoints to Microsoft 365 and Dynamics 365. However, you can add your custom endpoints by clicking Add Endpoint.
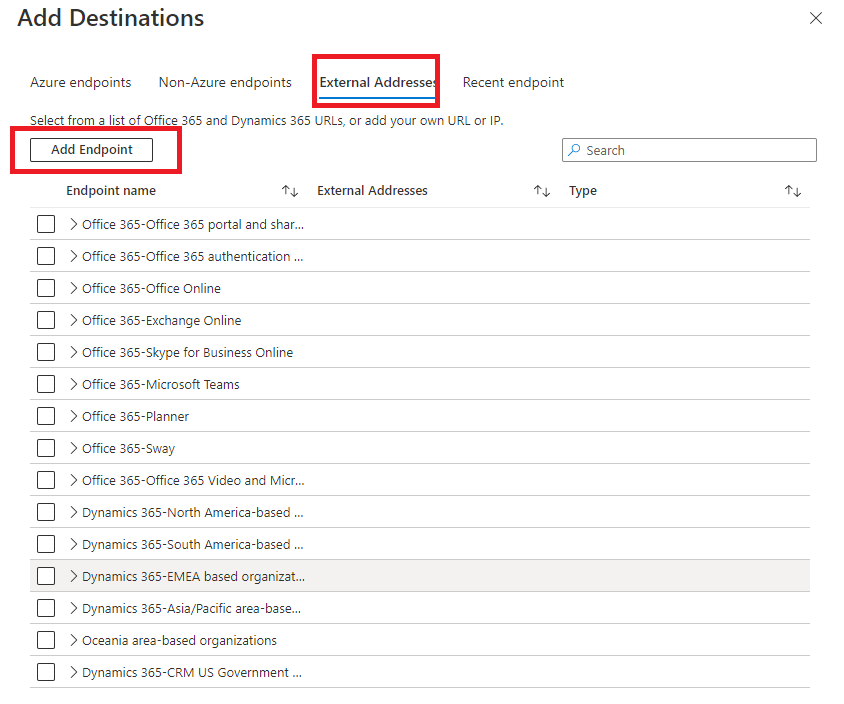
Click on add endpoint, and submit the URL or IP address of the endpoint; in our example, we will be using www.bing.com.

Once complete, that finishes our test configuration. Click add test group. You will then be displayed with an overview of the configuration.
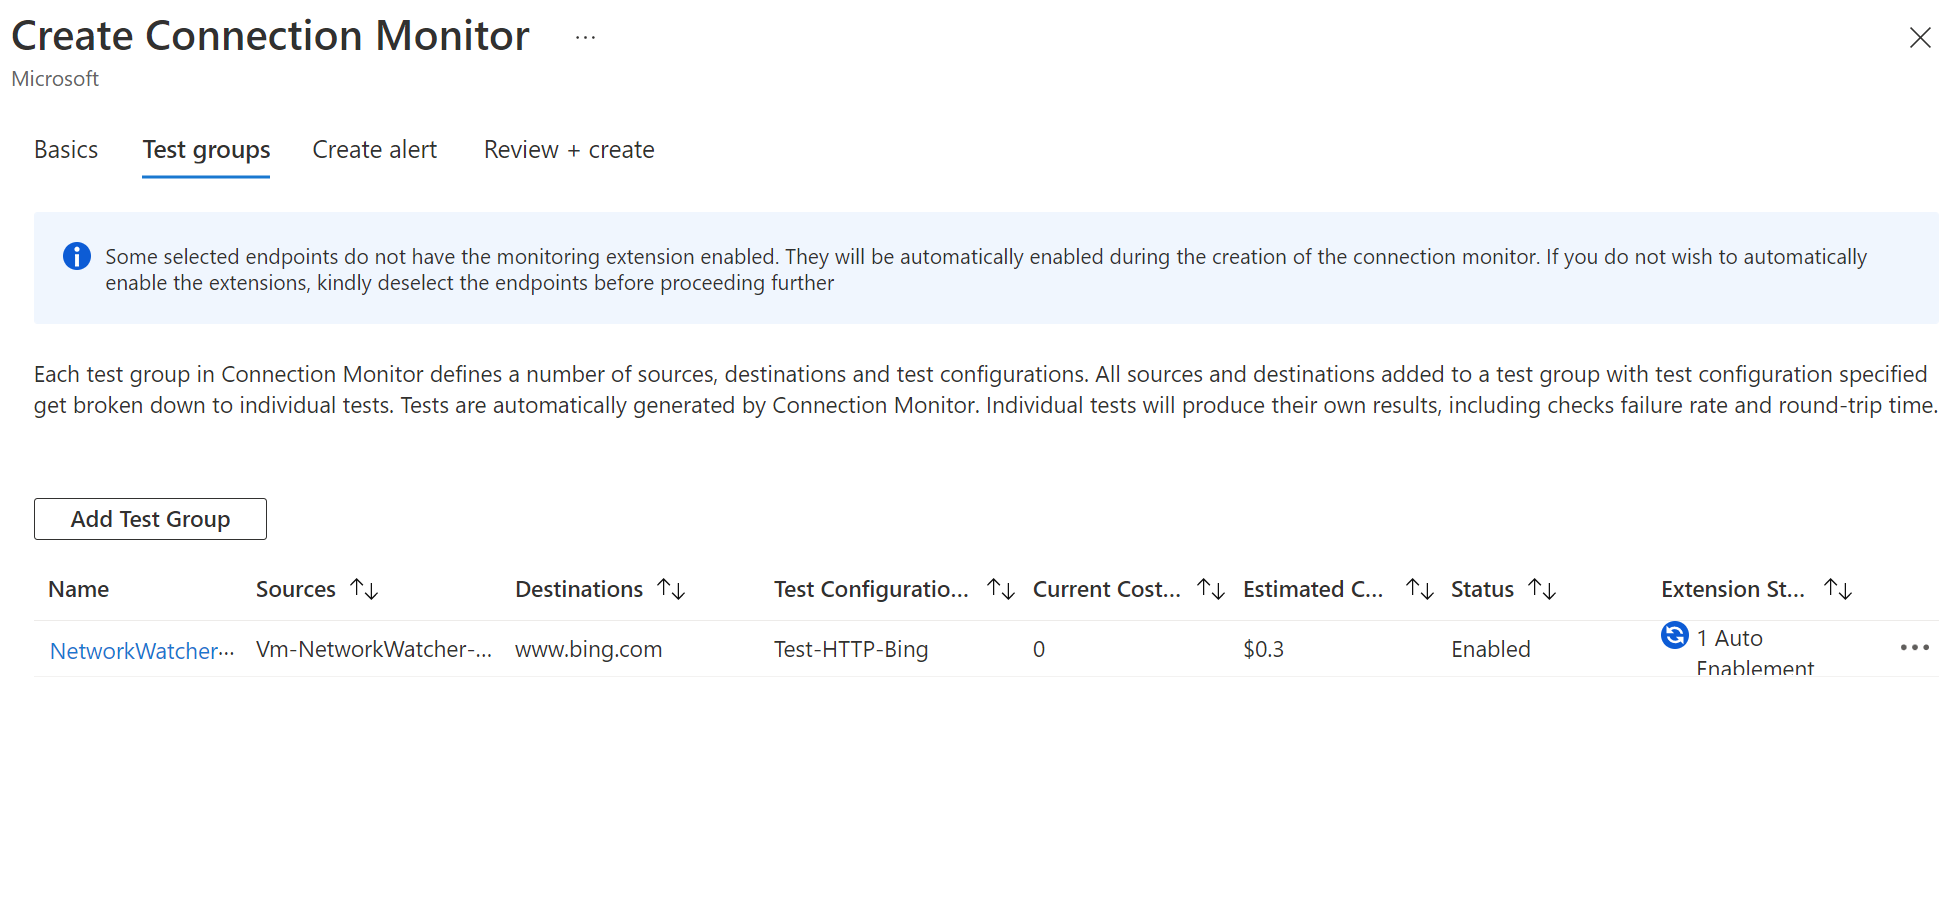
Optionally from here, you could add other test groups, deploy the configuration now, or configure alerts to be added to Azure Monitor. Let's enable the alerts and finish our deployment.
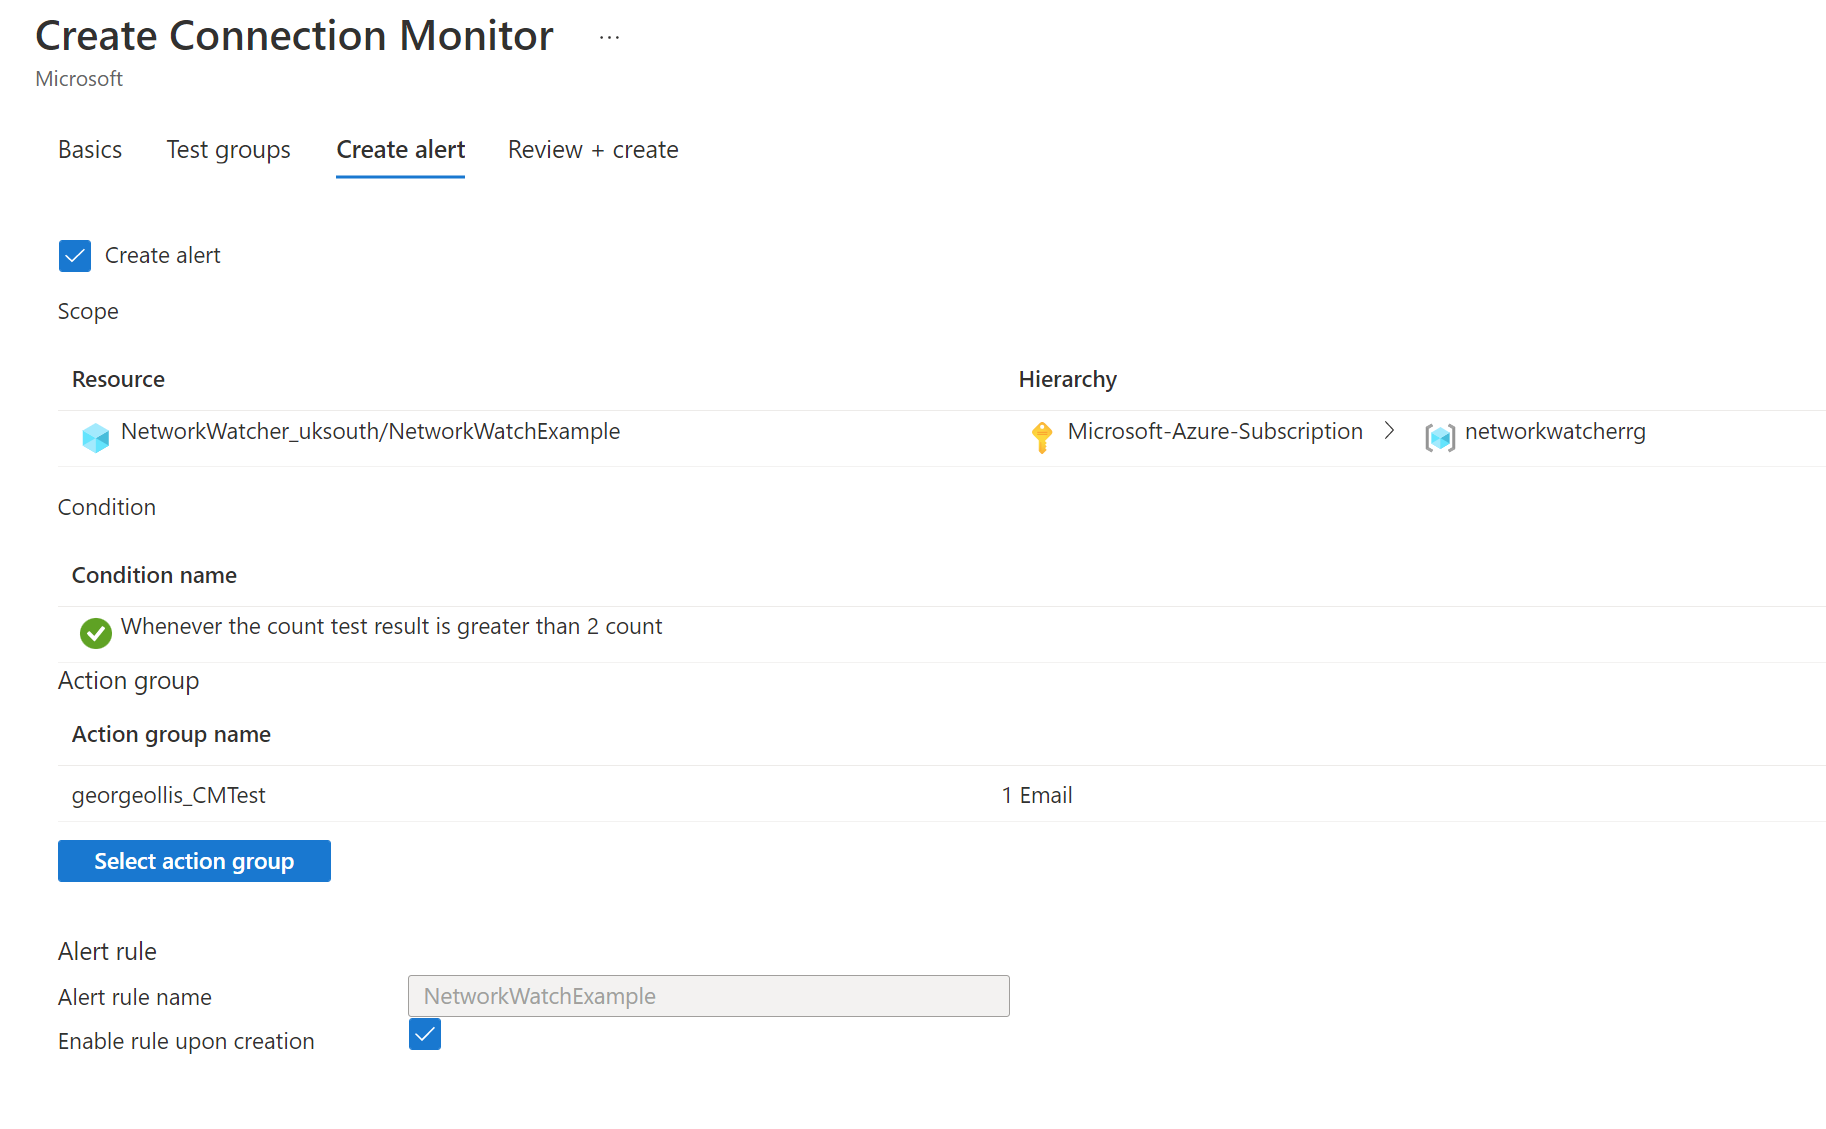
Clicking on the create alert tab will enable the corresponding alert in Azure Monitor and attach an action group to the alert. Our action group will fire an email to me. Once happy, click review and create.
We can now see our connection monitor resource called NetworkWatchExample in Azure.
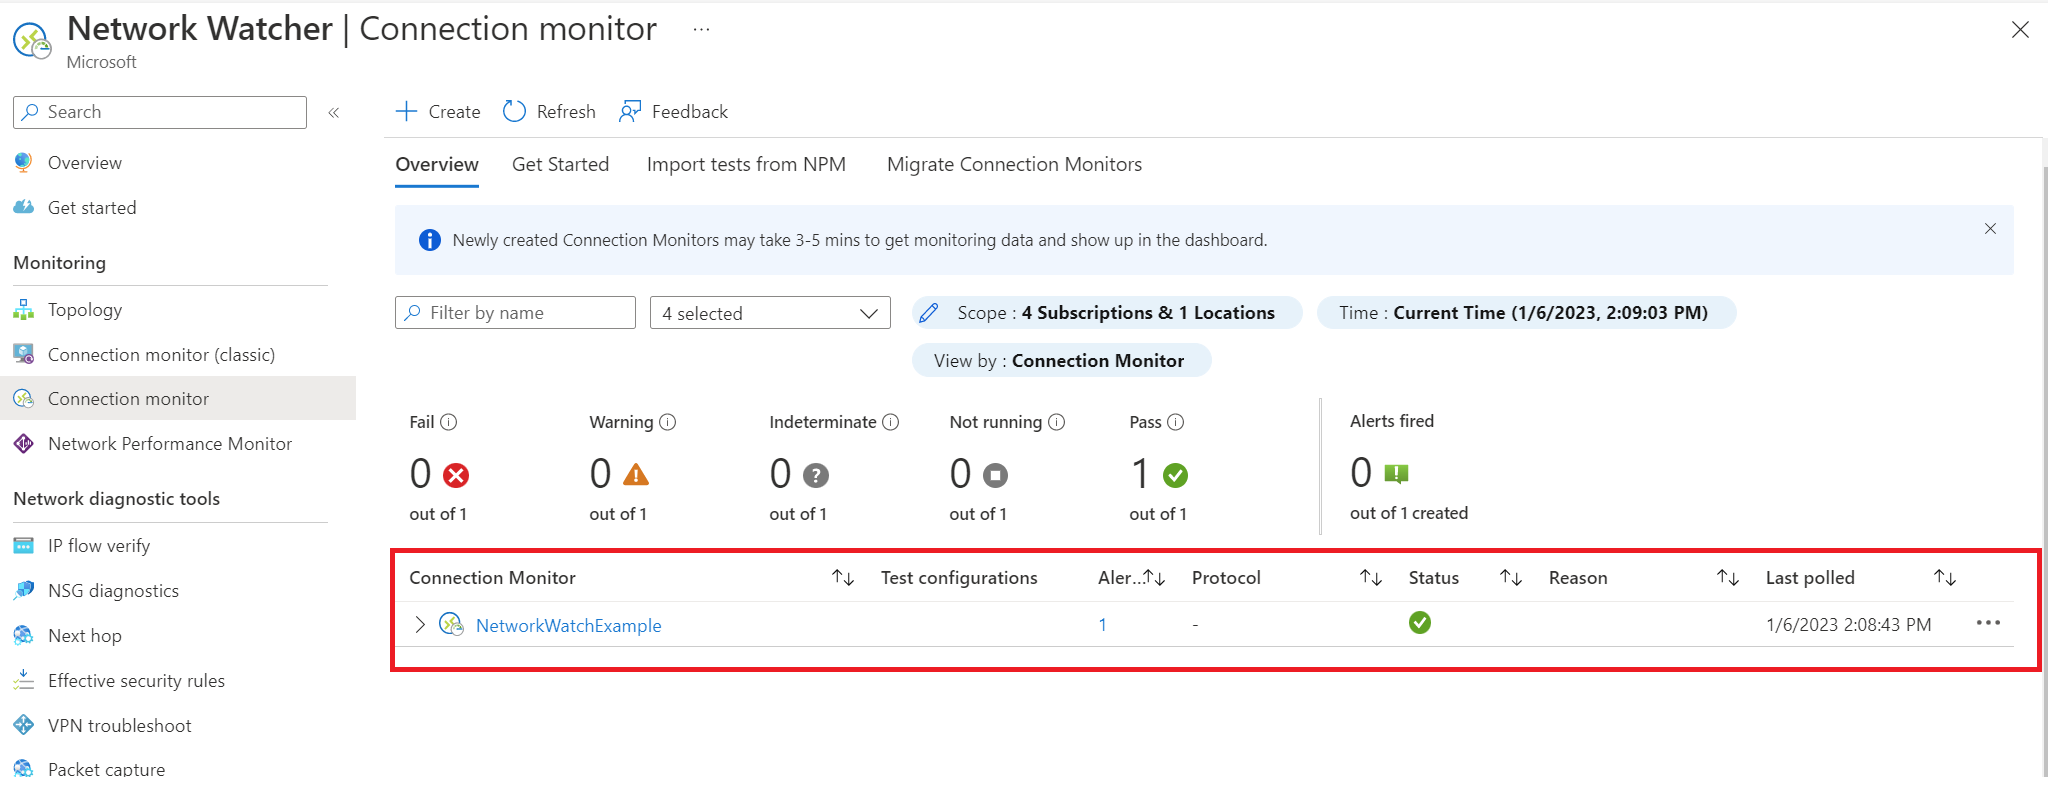
Selecting our connection monitor resource will provide a dashboard showing us metrics from the test configurations. This is helpful.
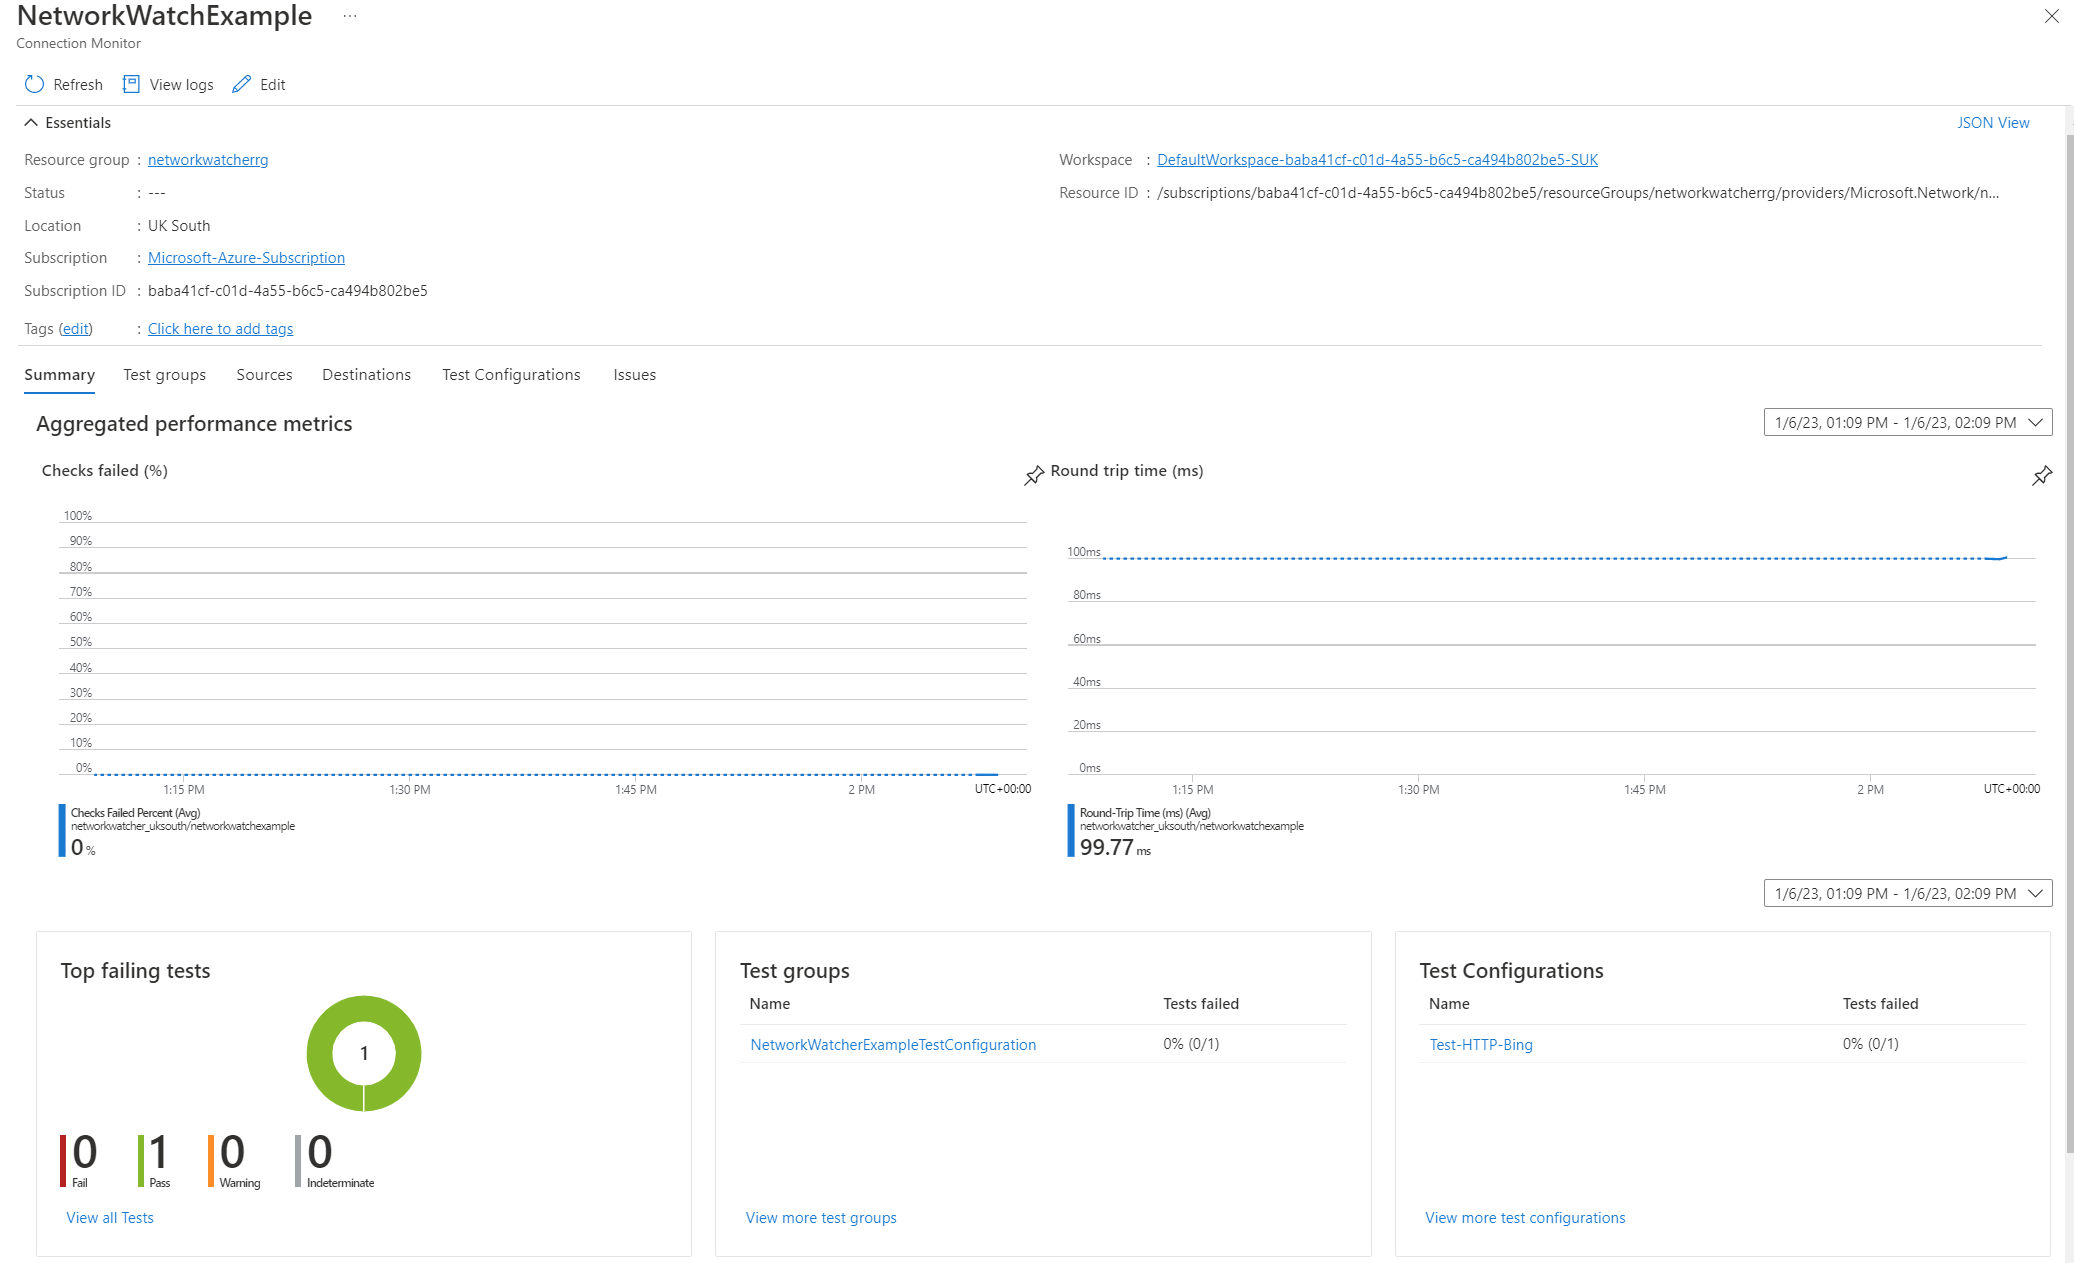
It's important to note that our sources can be virtual machines in Azure or non-Azure virtual machine resources.
This means that the tests are being run from those selected machines, and when configuring via the portal, the virtual machines are installed with the AzureNetworkWatcherExtension automatically. This must be installed on the devices before test configurations can run. You can see this extension on the virtual machines.
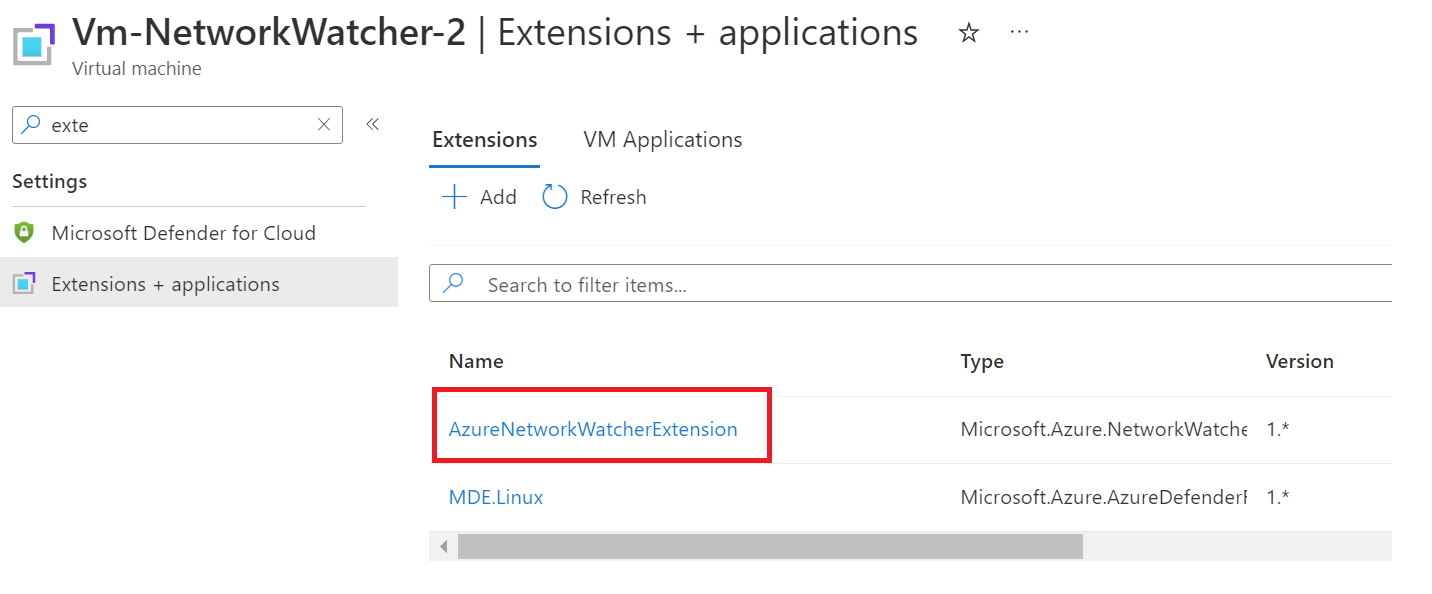
I would recommend having a look at how the extension works through the document Microsoft provide here: Azure Network Watcher Agent virtual machine extension for Windows - Azure Virtual Machines | Microsoft Learn
Monitoring Connection Monitor
As previously shown, selecting the connection monitor resource will guide you to built-in metrics.

However, at the beginning of the deployment, we also needed to provide a log analytics workspace. The data from the connection monitor resource can be viewed and queried through the workspace for additional troubleshooting or to view trends.
Heading to our workspace and running a simple query to bring back our test configuration shows the available data.
NWConnectionMonitorTestResult
| where TestConfigurationName == "Test-HTTP-Bing"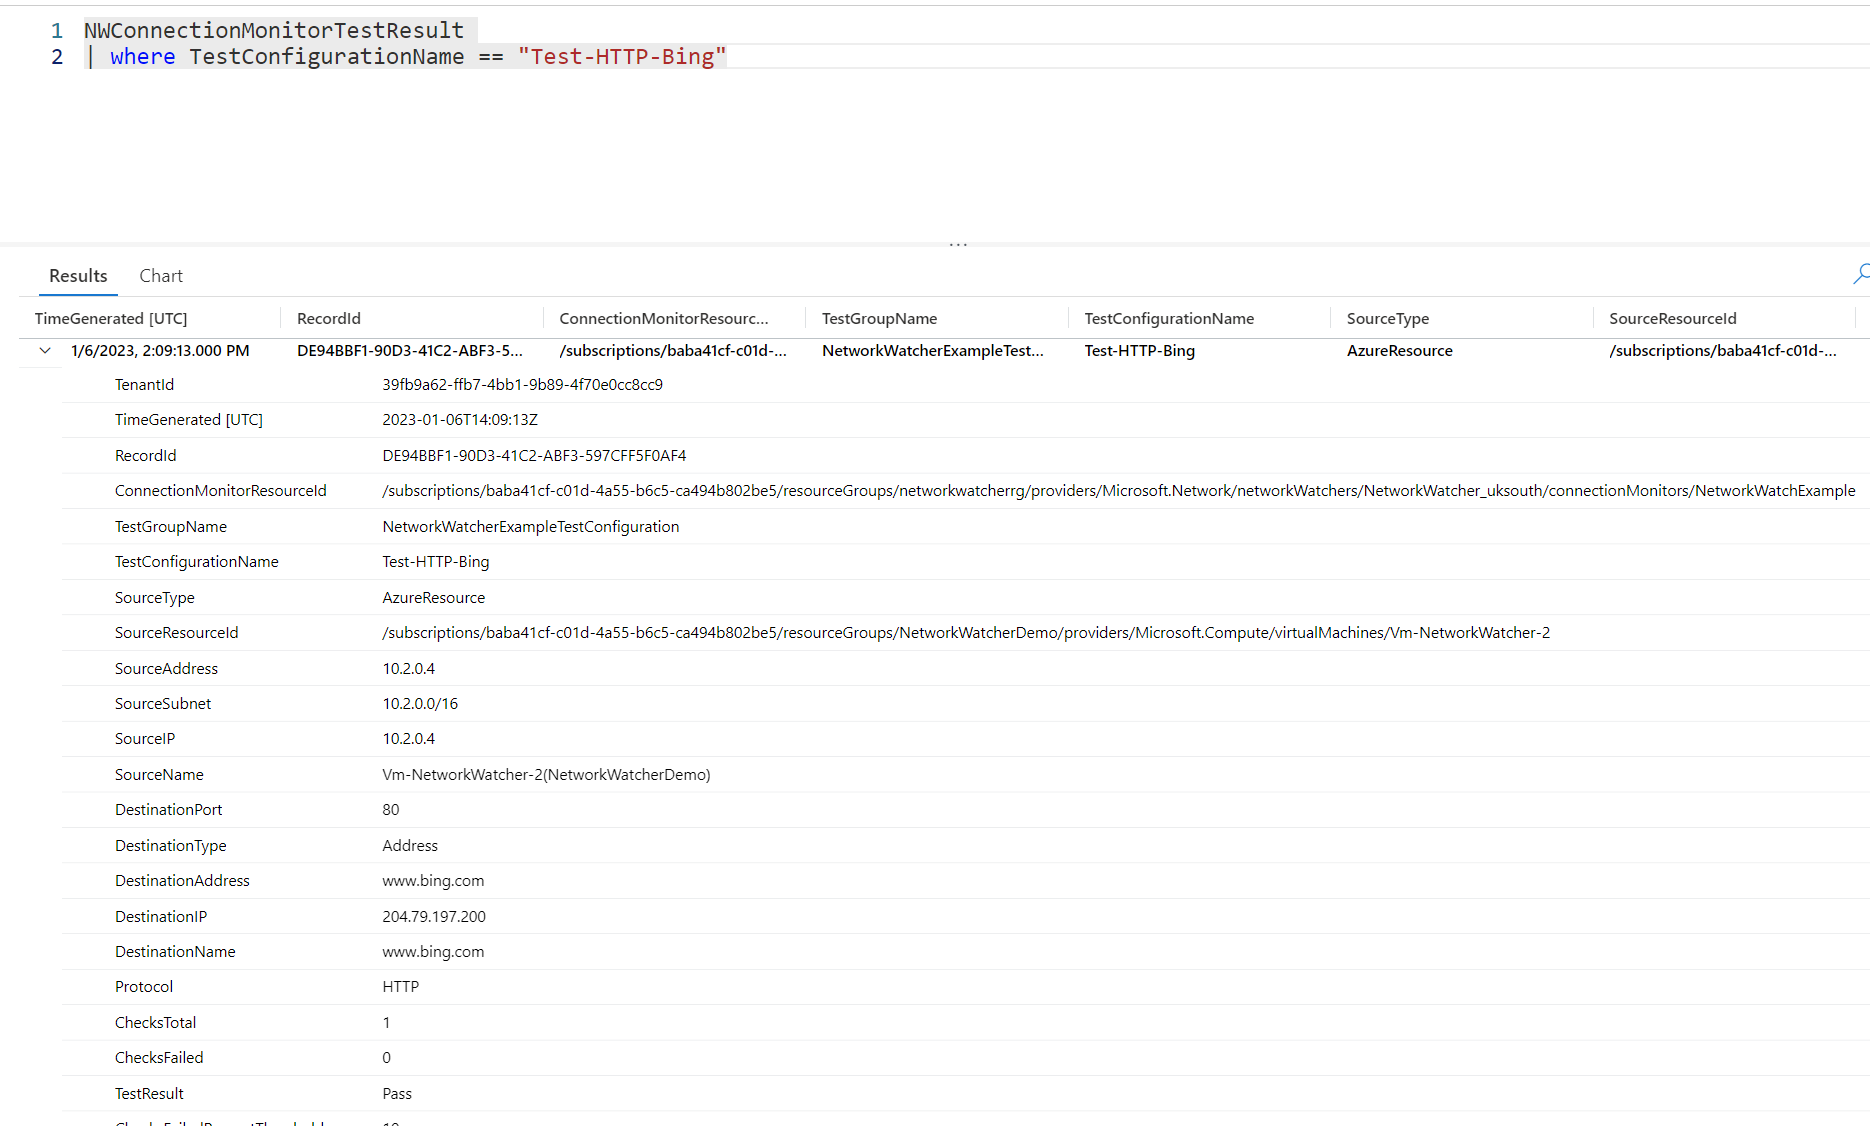
NWConnectionMonitorTestResult
| where TestConfigurationName == "Test-HTTP-Bing"
| summarize by bin(TimeGenerated, 1m), AvgRoundTripTimeMs, TestConfigurationName, SourceIP, DestinationName
| render timechart
Another example provides a time chart of the average round trip time of the test. This can be useful for seeing traffic spikes and trends.
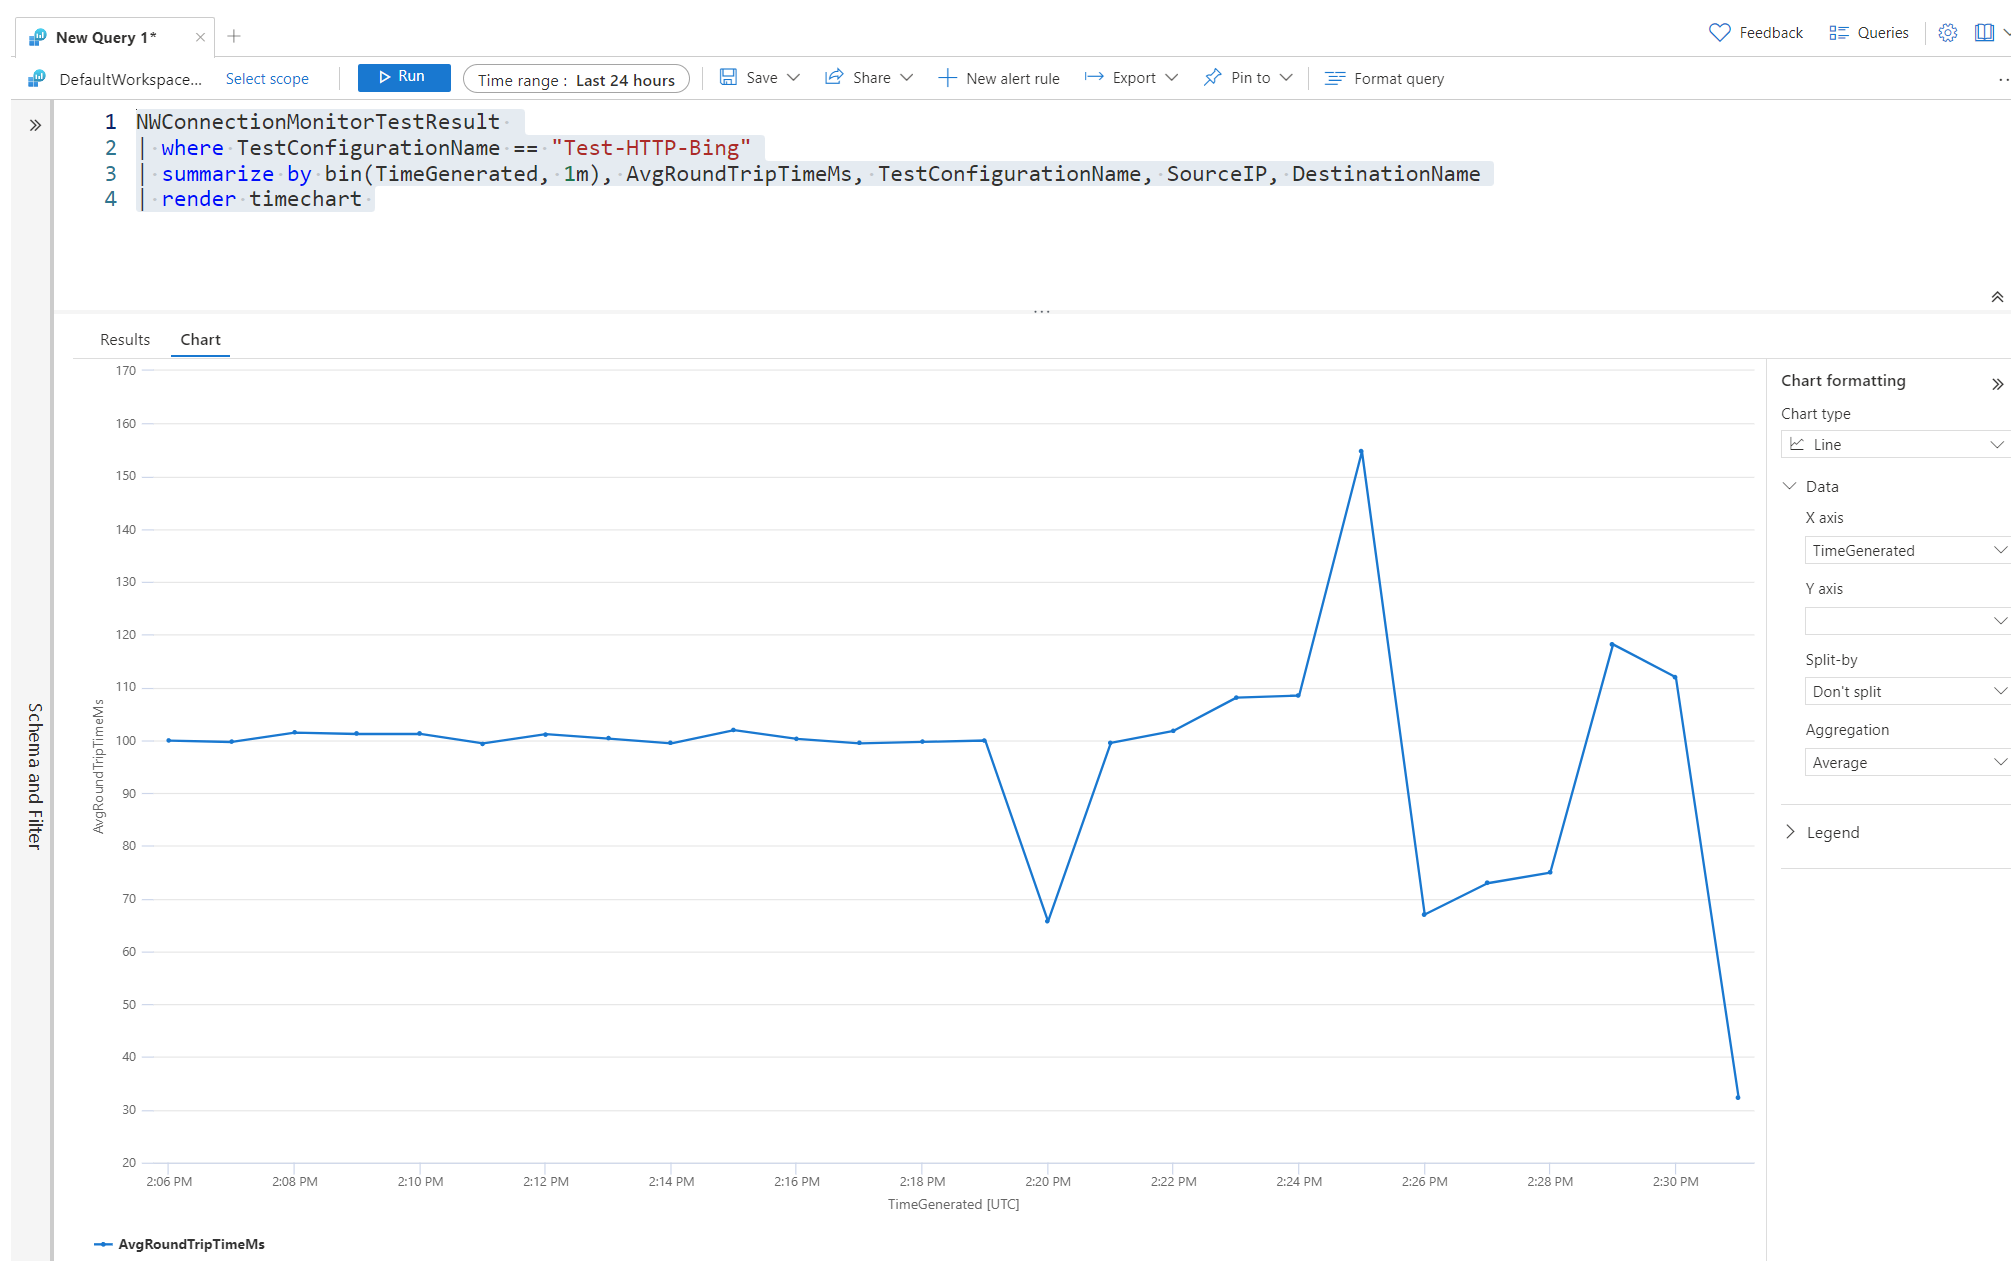
Let's look at now blocking traffic to www.bing.com. This will confirm if our alert is working and if we can see any failures when monitoring our resources. I edited the host file in this example within /etc/hosts and pointed www.bing.com to 127.0.0.1 to test a connection failure.

We can now see failures within the connection monitor overview for our test. Let's see what appears in the workspace by running the following query.
NWConnectionMonitorTestResult
| where TimeGenerated > ago(5m)
| where TestConfigurationName == "Test-HTTP-Bing"
| project SourceAddress, DestinationPort, DestinationIP, TestResult, DestinationAddress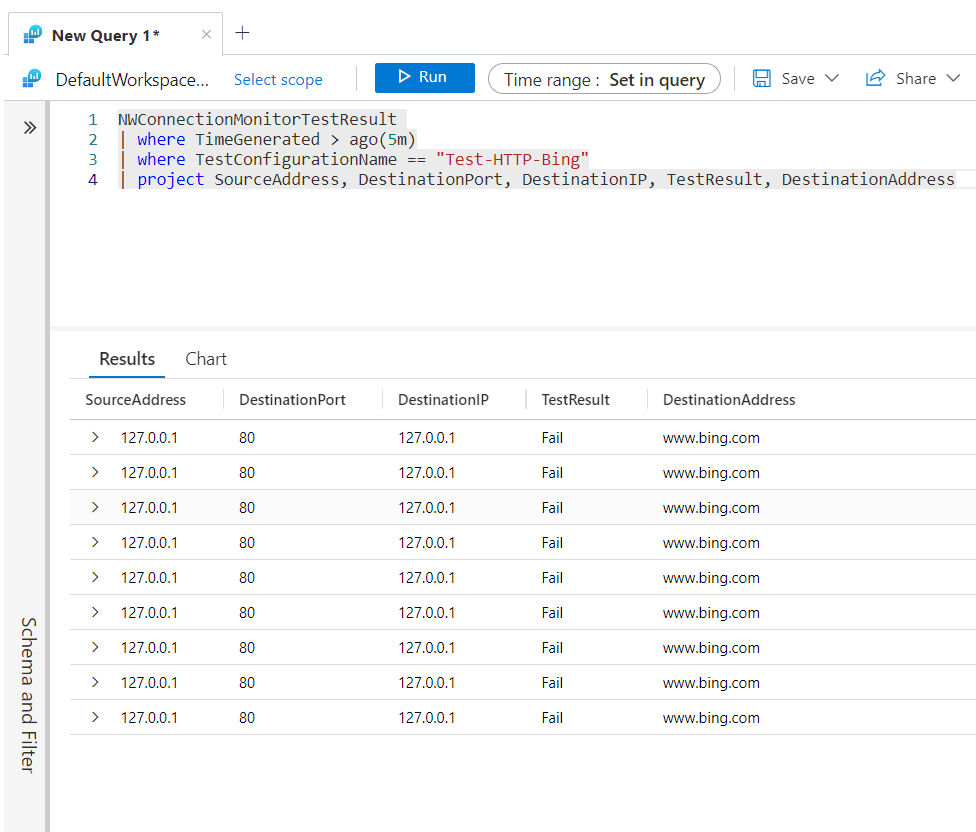
You can now see that the test result is coming back as failed. This is because we changed the host file on the VM, although the logs expose the data we need. After all, we can identify a potential issue by looking at the source address for www.bing.com.
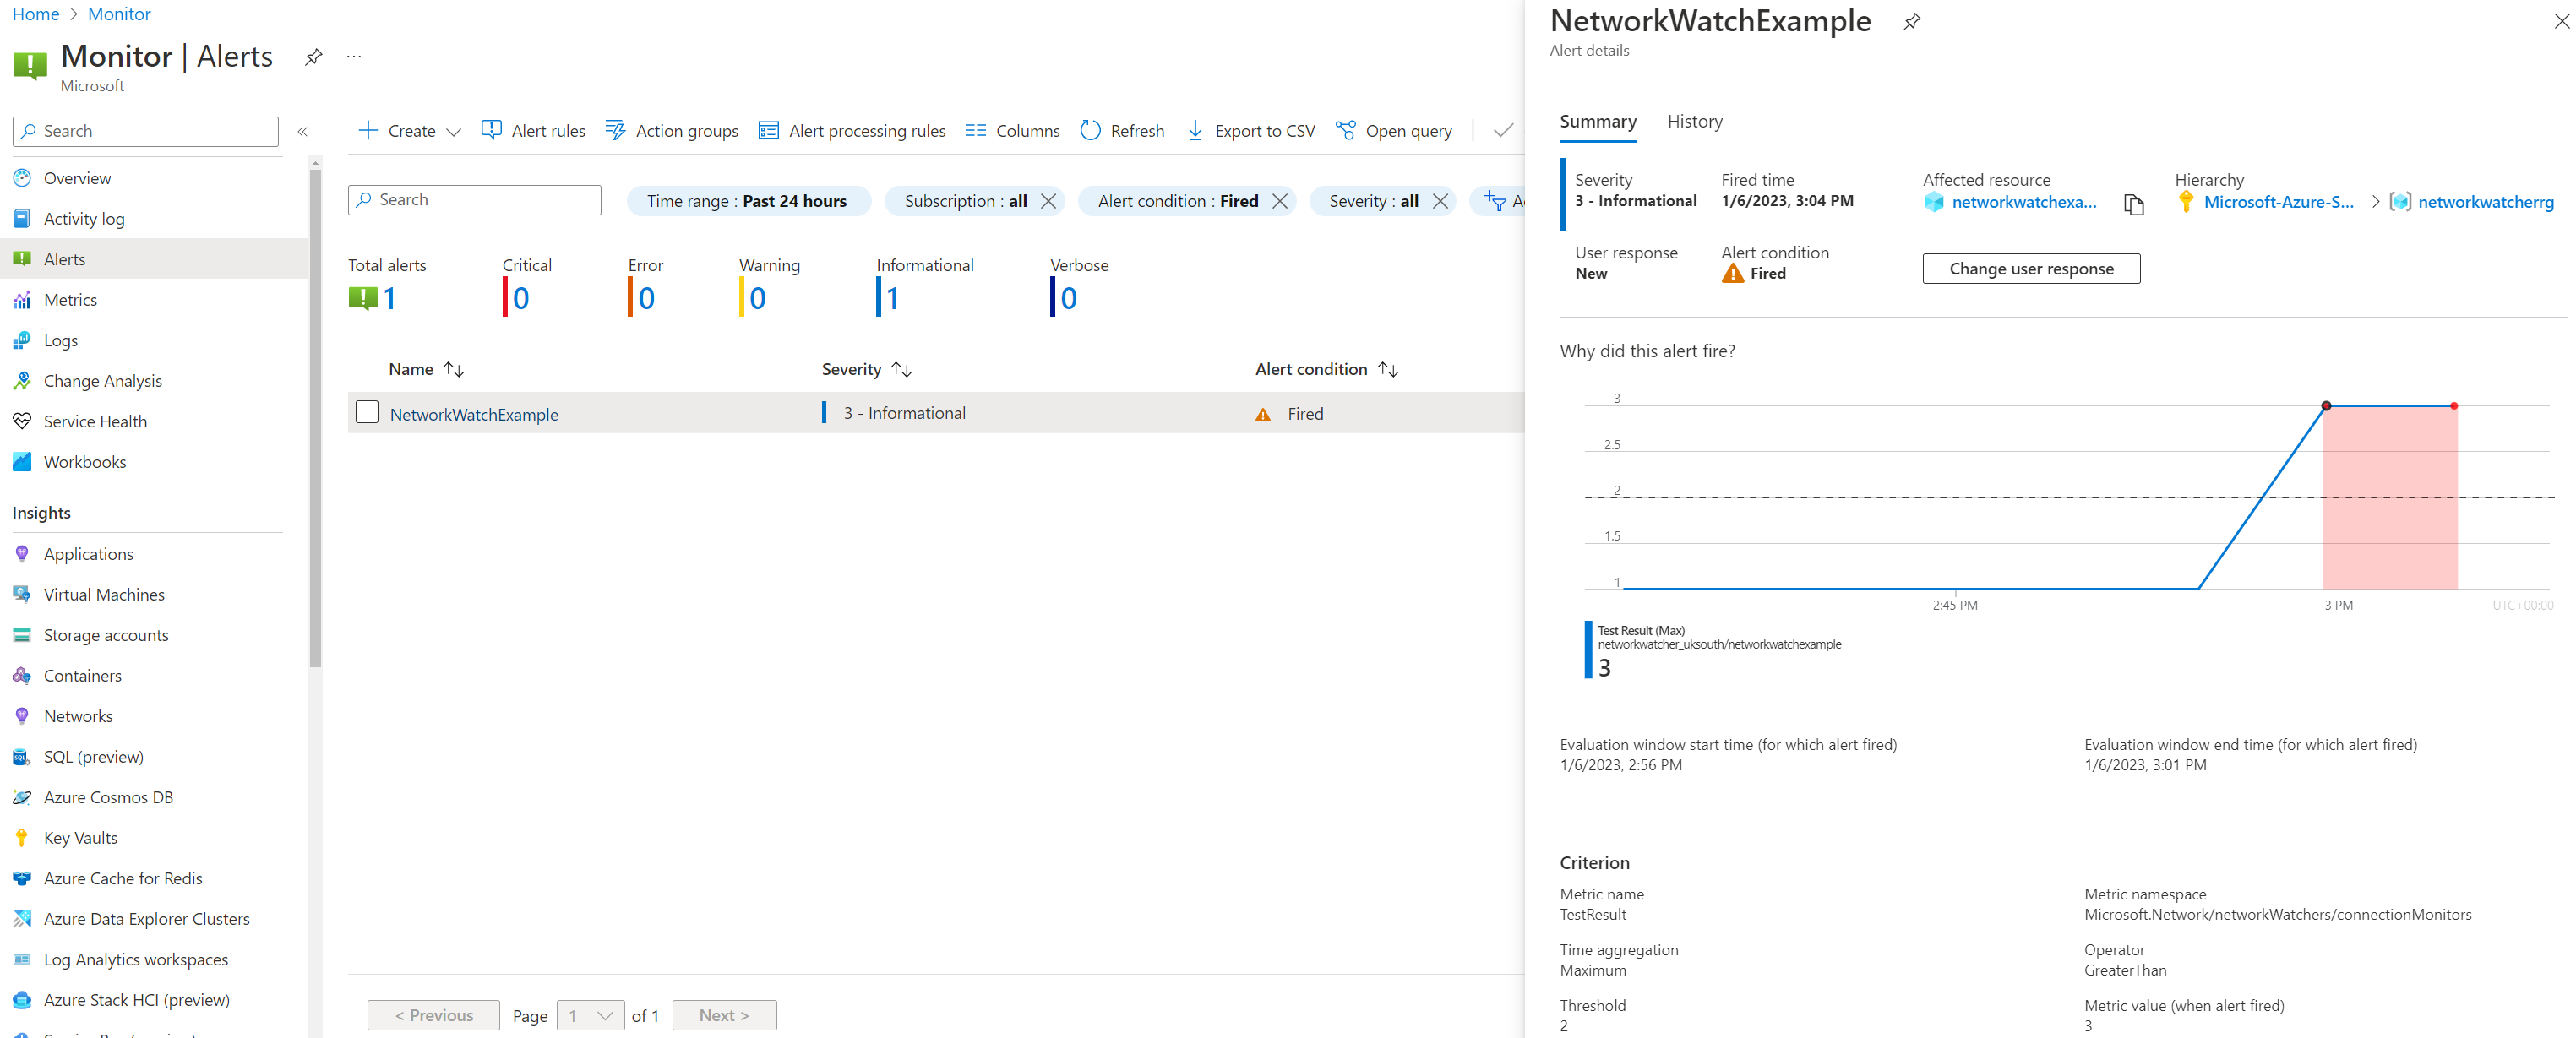
As we integrated the test with Azure Monitor, we also received an email when the failure threshold was reached, and we can see the new alert in Azure Monitor.
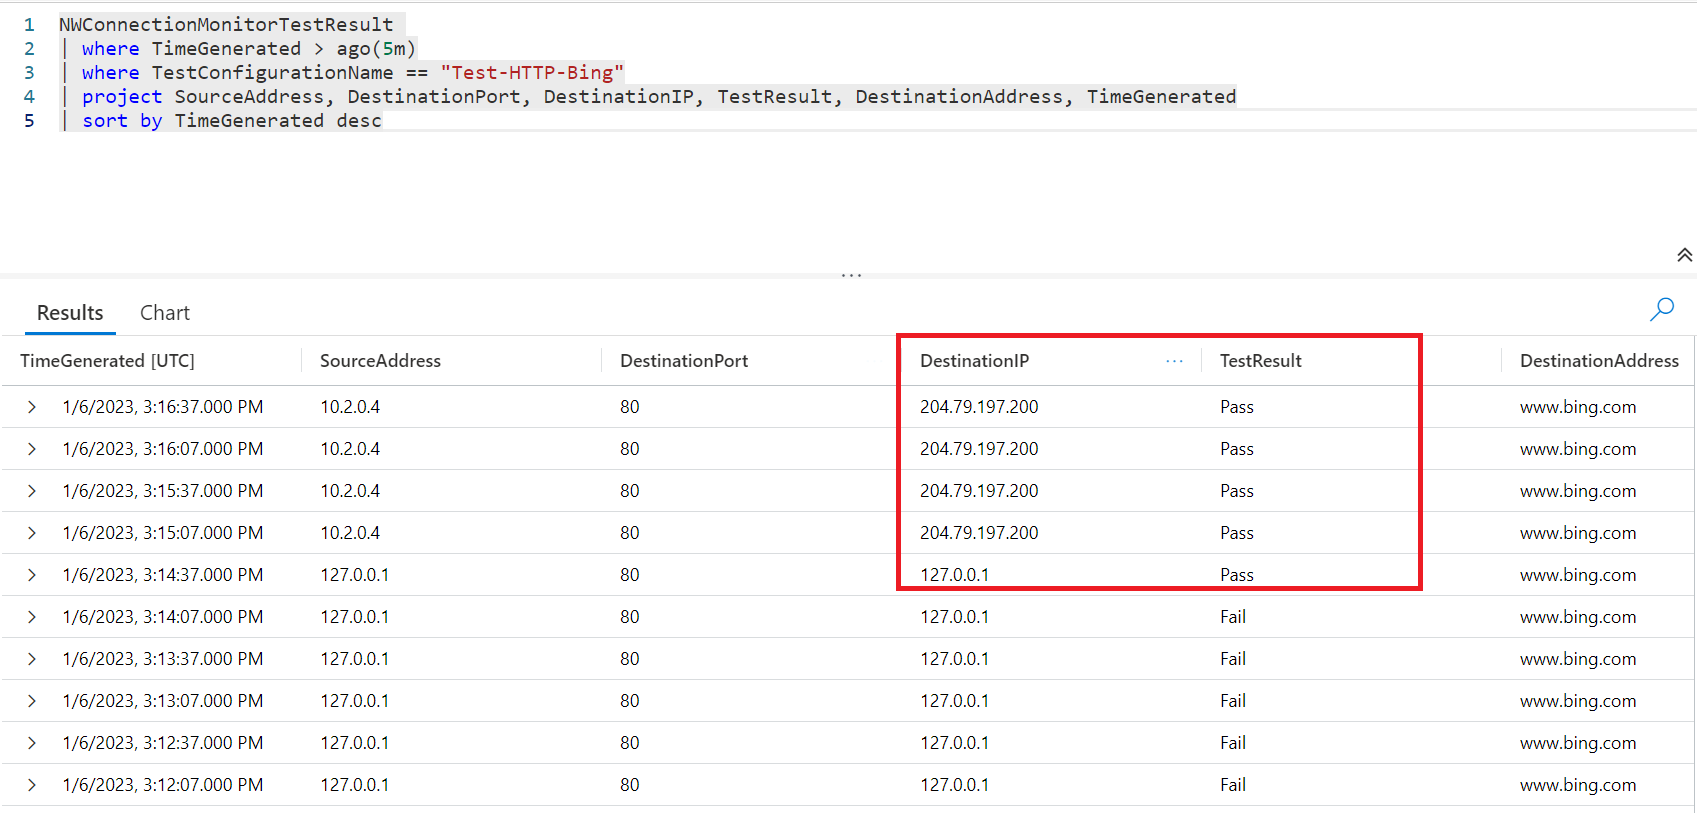
After fixing the issue, we can now see connection monitor is reporting that the configuration is back working. Although for some strange reason, the DestinationIP for the first pass result shows 127.0.0.1, it quickly changes to the public IP address of www.bing.com.
IP Flow Verify
The next tool on our list is the IP Flow Verify tool, which verifies if a packet is allowed or denied to or from a virtual machine based on 5-tuple information.
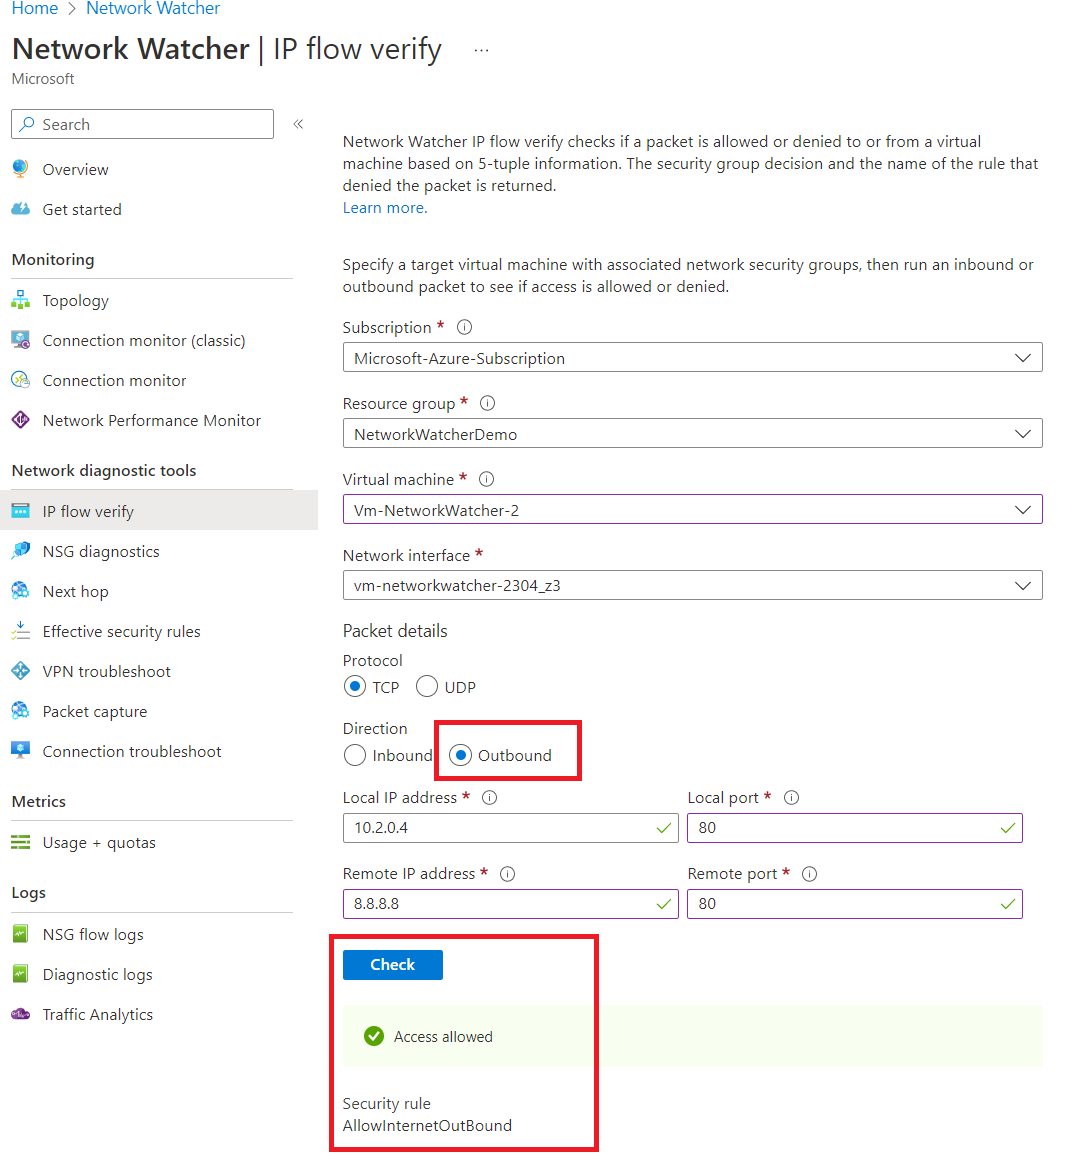
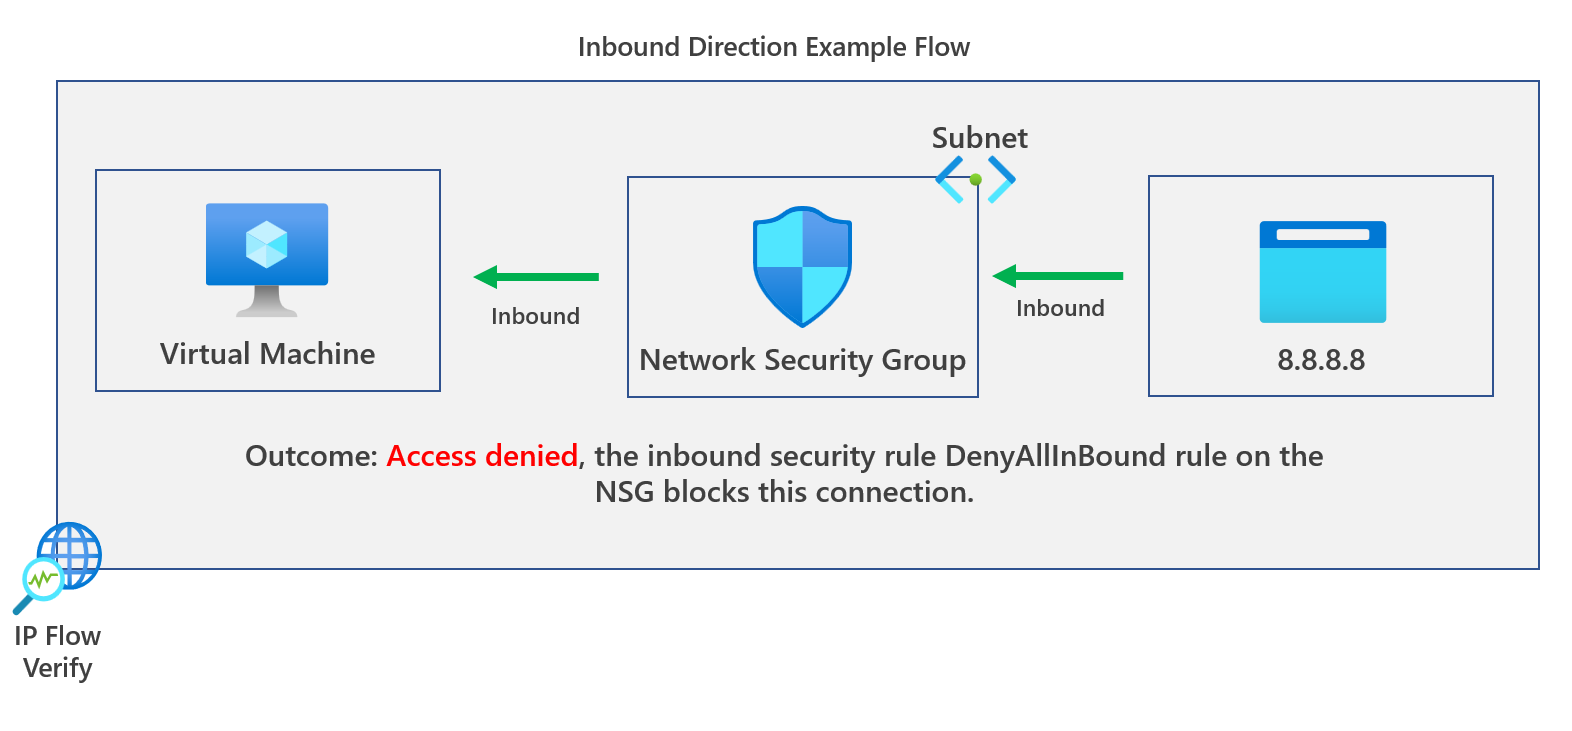
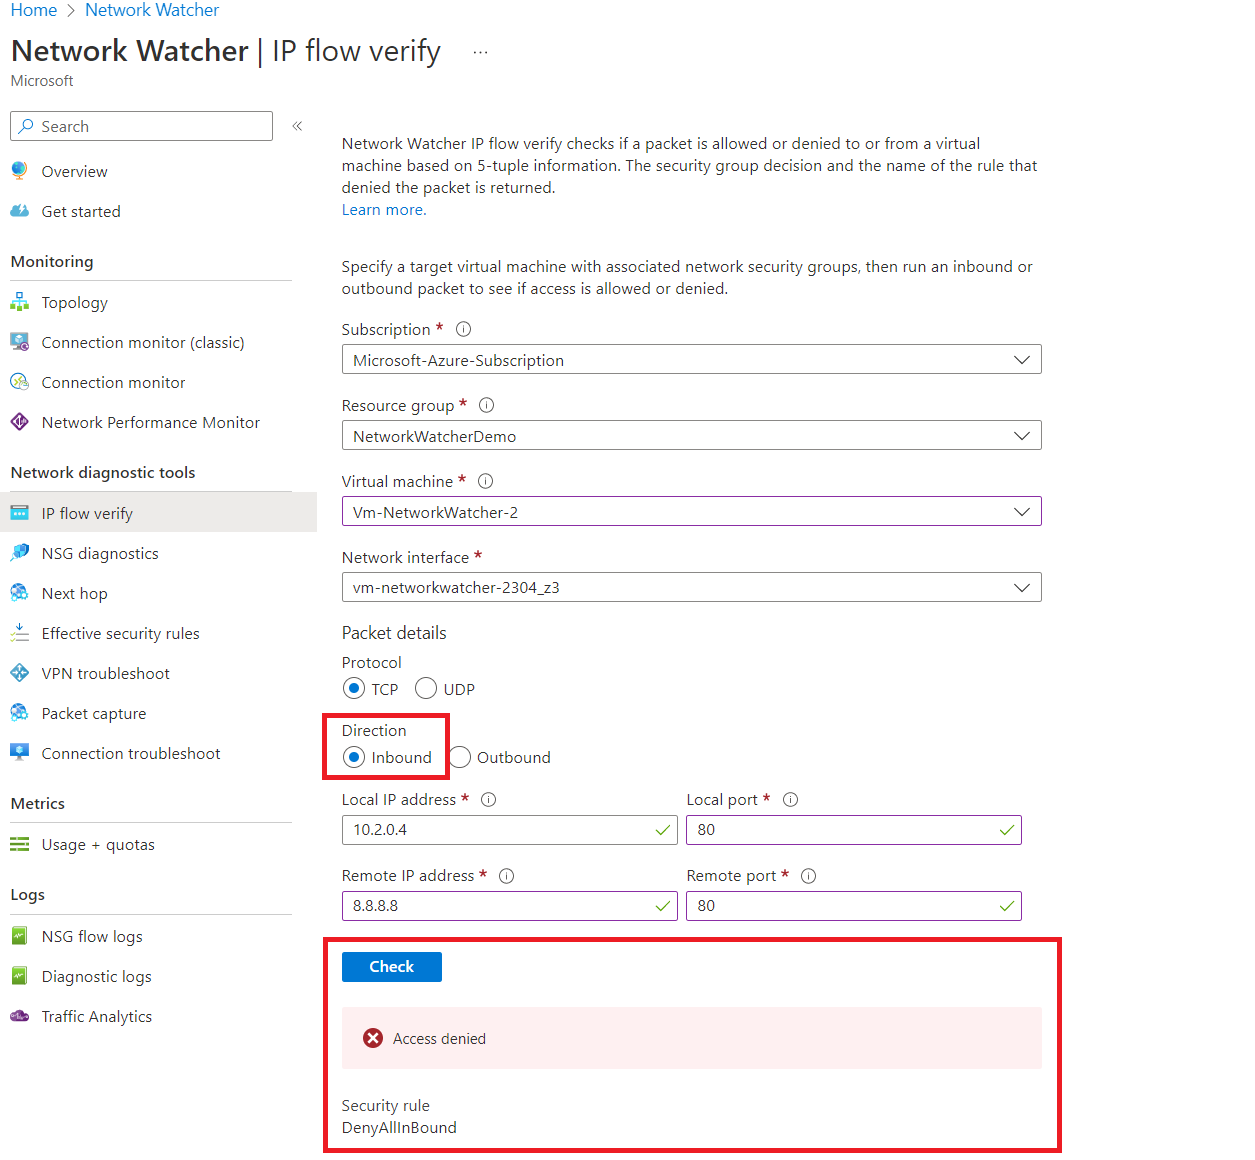
The network security group and the name of the specific rule are provided to the administrator once the flow verification is complete. This can be especially helpful when troubleshooting connectivity issues and ensuring traffic can reach the inbound or outbound of a VM running in Azure.
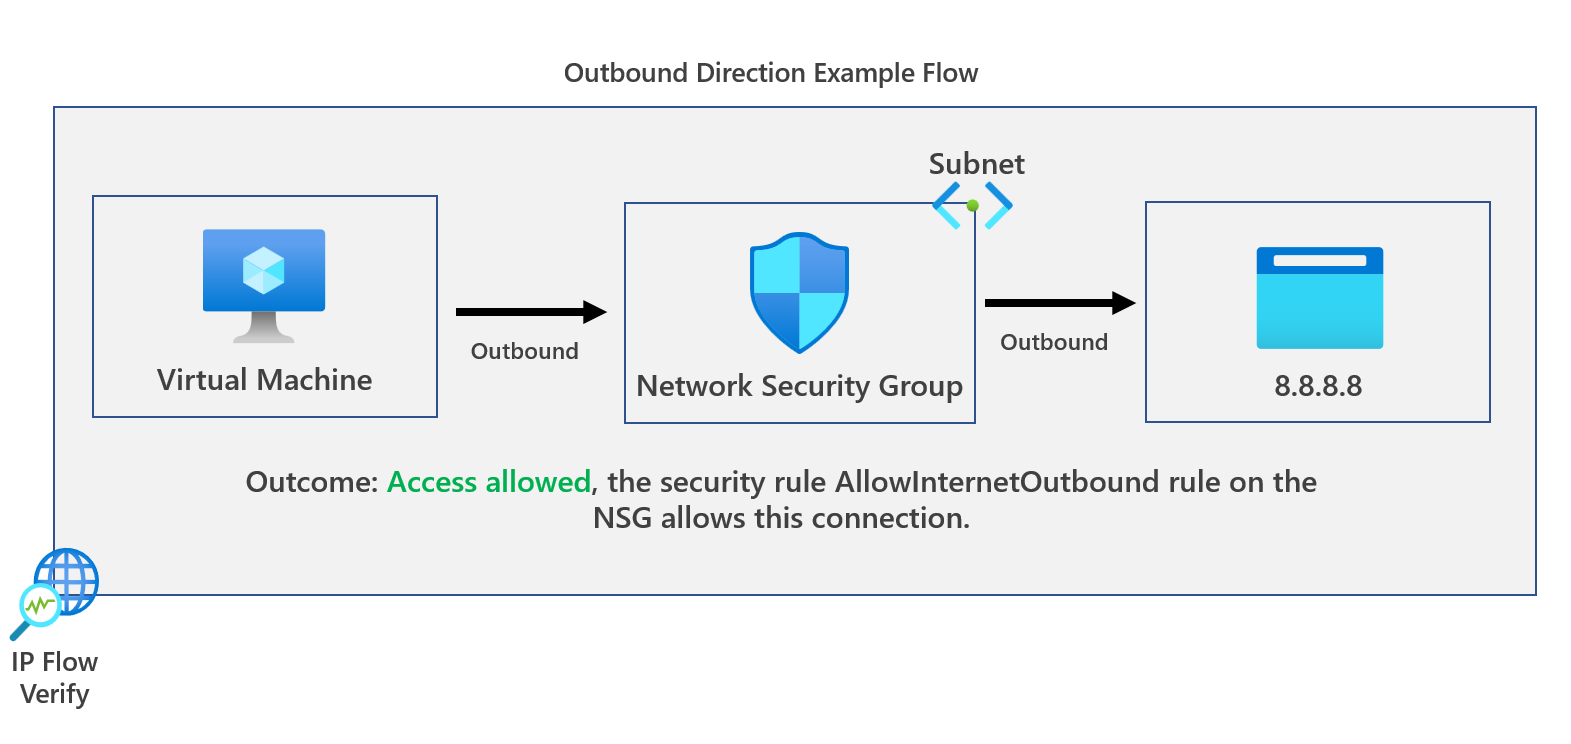
Let's run an outbound test first from our Azure VM. The IP address is 10.2.0.4 to 8.8.8.8 (Google DNS) on port 80, and confirm if we can access it. The IP flow verify configuration for this would be the following.
Let's now look at the inbound direction flow using the tool.
NSG diagnostics
This tool is very similar to IP Flow Verify, where again, it looks for inbound and outbound connections and provides you with a list of NSGs that would allow or deny the connection. However, there are some slight differences.
The supported protocols for this tool are Any, TCP, UDP and ICMP, whereas IP Flow Verify only supports TCP and UDP. W
We also get additional supported resource types for verifying traffic, including virtual machines, network interface cards, VM scale sets network interfaces and Azure Application Gateway.
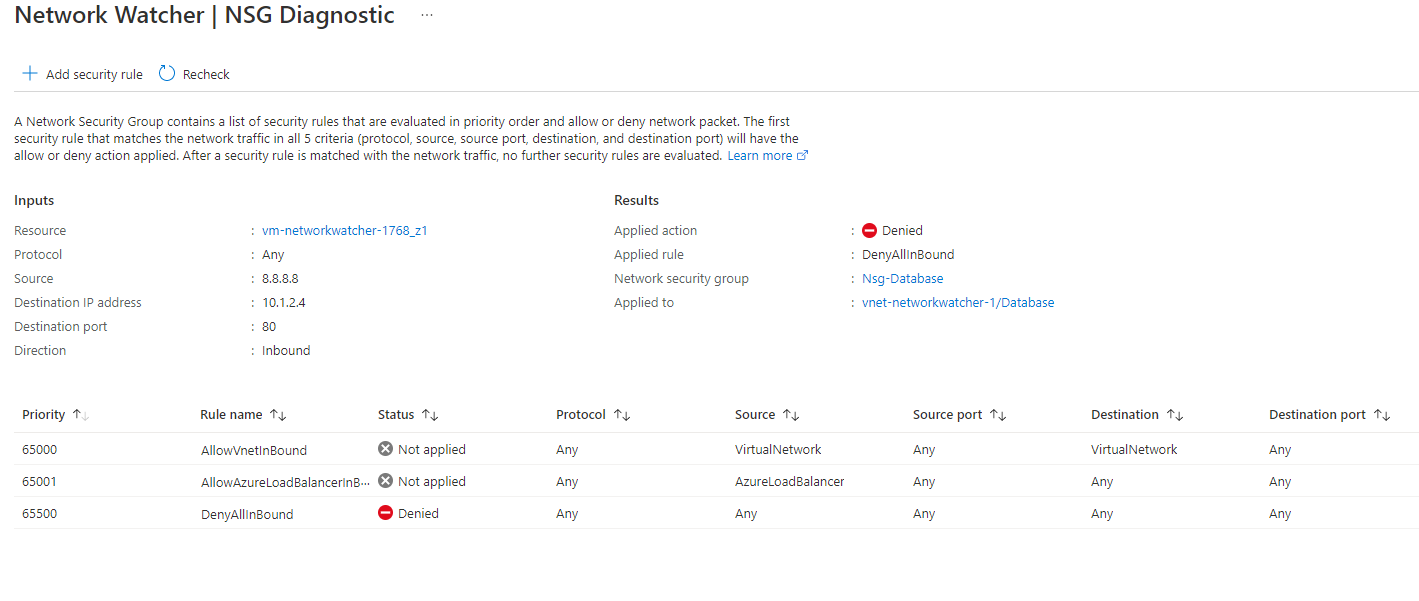
Let's first have a look at the inbound direction of NSG diagnostics. In this example, we check if IP address 8.8.8.8 can reach 10.1.2.4 on port 80, the traffic status returned is denied and provides an overview of the NSG rule that blocked that traffic.
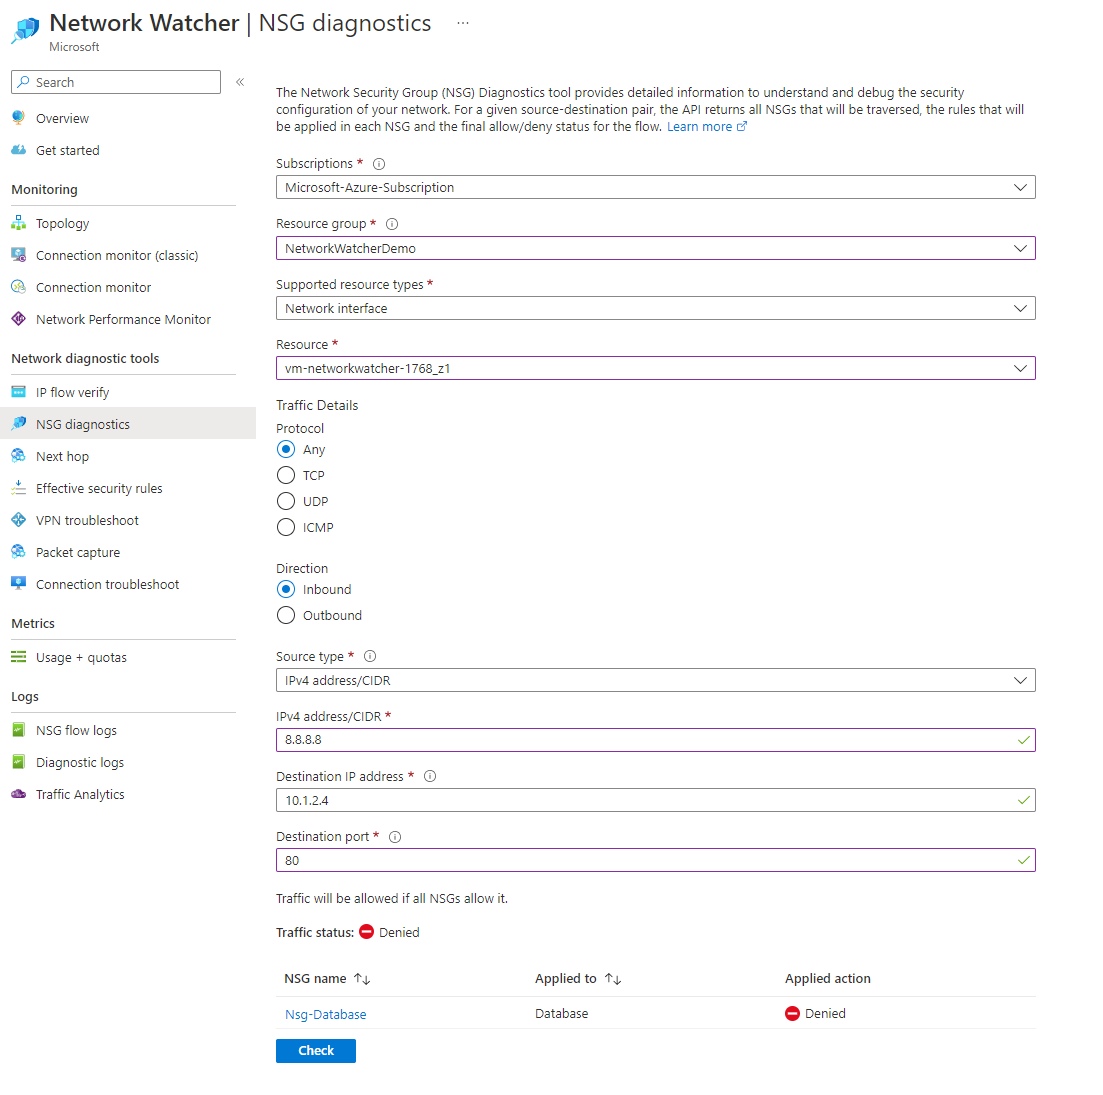
Clicking on the name of the NSG that blocked the traffic will provide a better overview of what rule blocked the traffic and the specific law.
Let's swap the direction to inbound from outbound and perform the same test. This time we will be checking if the NSG would allow traffic originating from 10.1.2.4 to 8.8.8.8 on port 80.
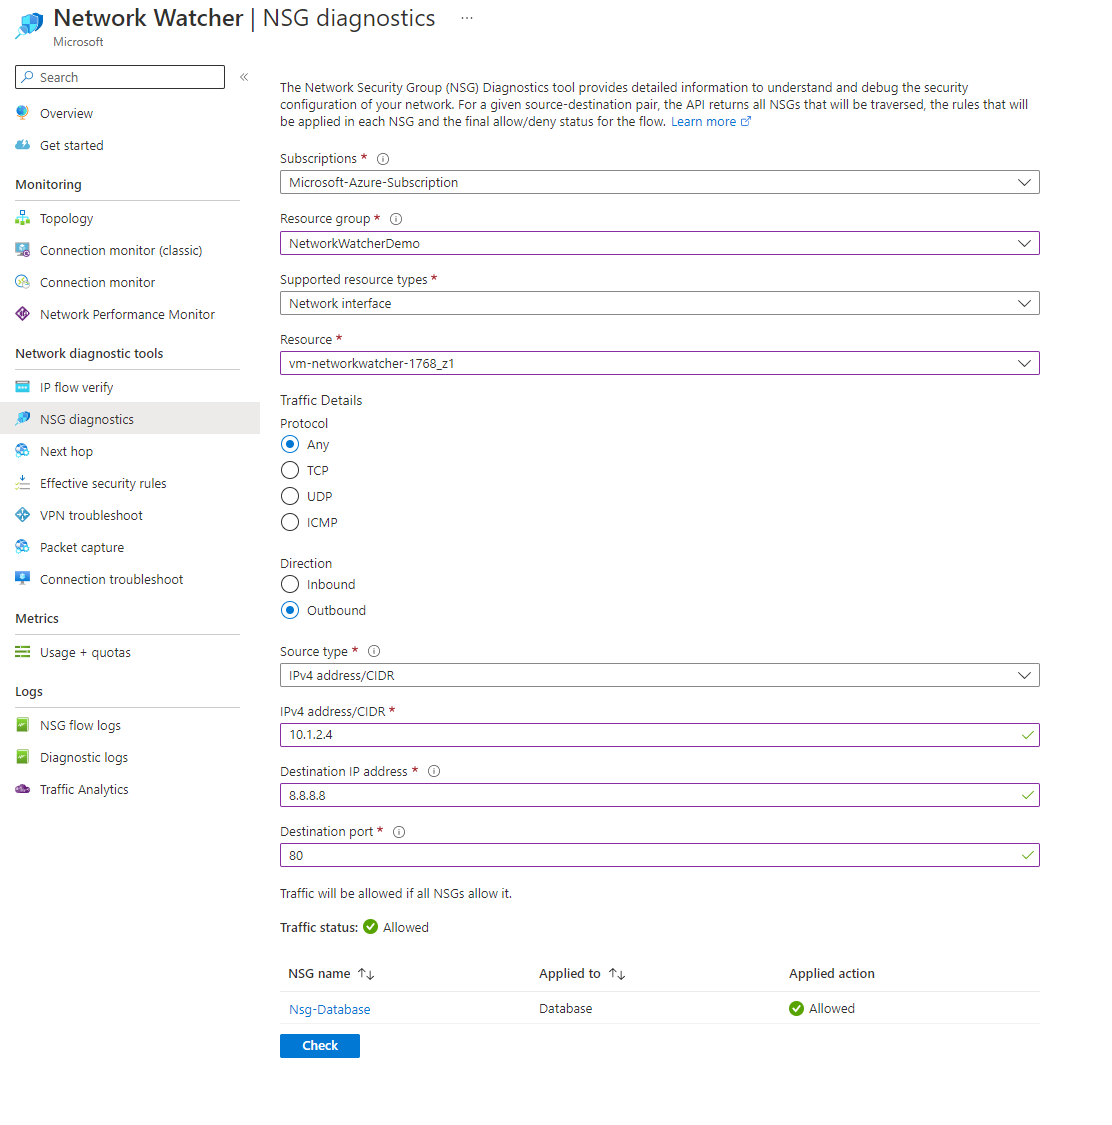
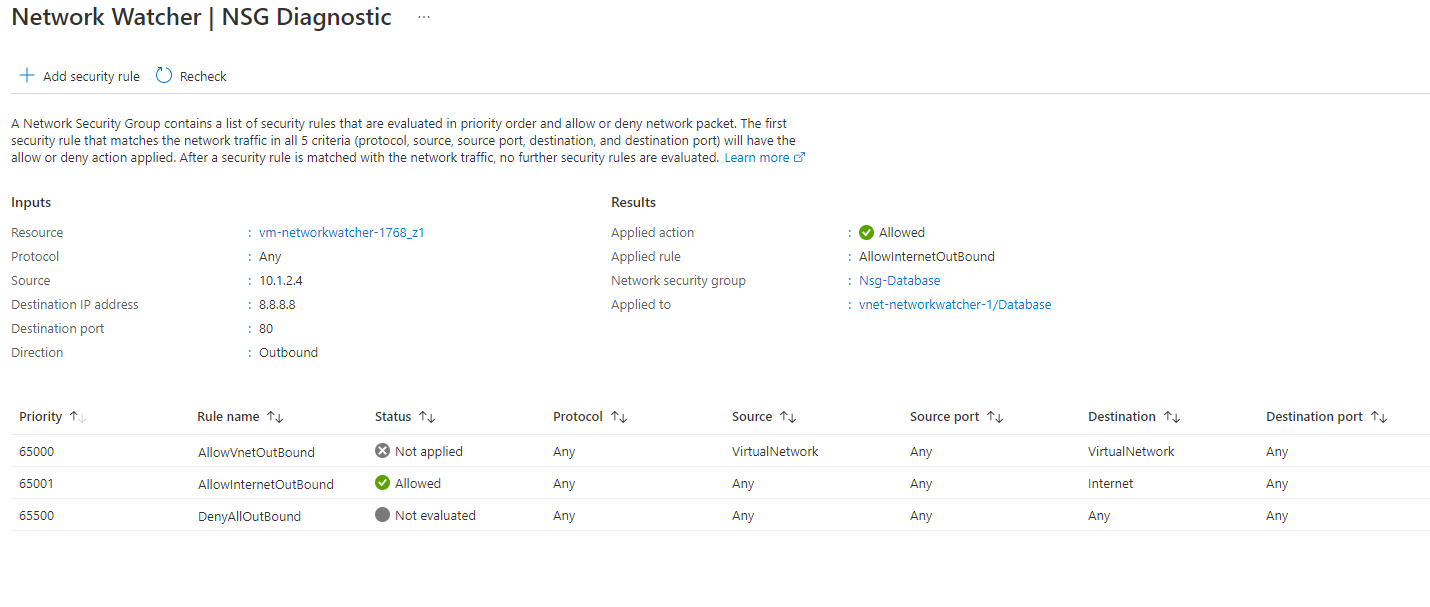
You can now see that outbound traffic going to 8.8.8.8 on port 80 would be allowed through the network security group. Selecting the name of the NSG again provides an excellent overview and what specific rule has allowed the traffic.
Next hop
This tool is simple but powerful. I've probably used this tool the most out of all the available tools, and it certainly saved me a few times. The Next Hop tool provides the next hop from a selected virtual machine to a specific destination IP address.
This is especially useful when using NVAs (Network virtual appliances) or a route propagation protocol such as BGP to confirm where you would be routed as a next hop for traffic.
If we first look at the next hop to 8.8.8.8, we can confirm the next hop type and where traffic would be routed. In this example, our next hop is the internet.
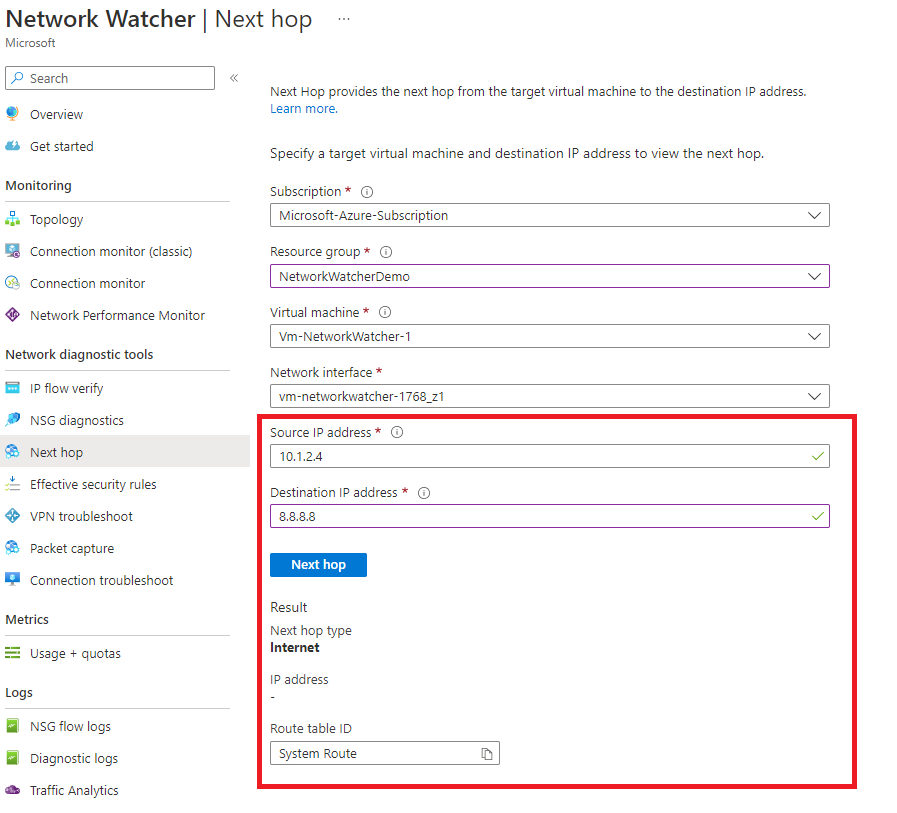
If we rerun the tool but change the destination IP address to 10.1.2.5, another IP address available in our virtual network, we can see that the next hop type changes.
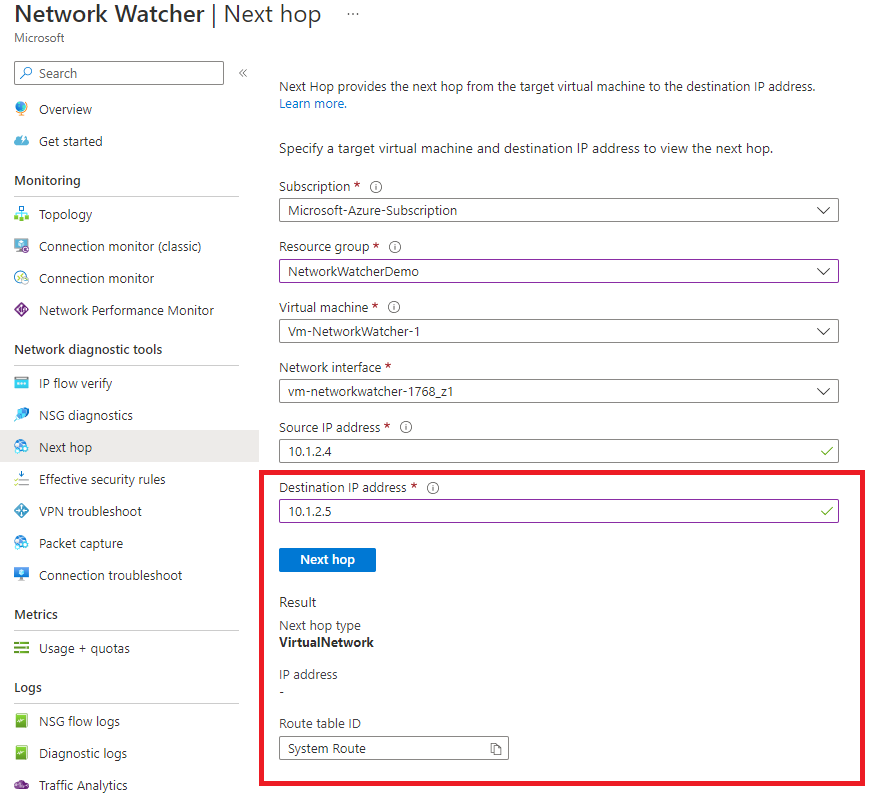
Finally, let's attach a route table to our subnet with a rule that states traffic going to 8.8.8.8 should go to our firewall at 10.1.2.8 and confirm it's working.
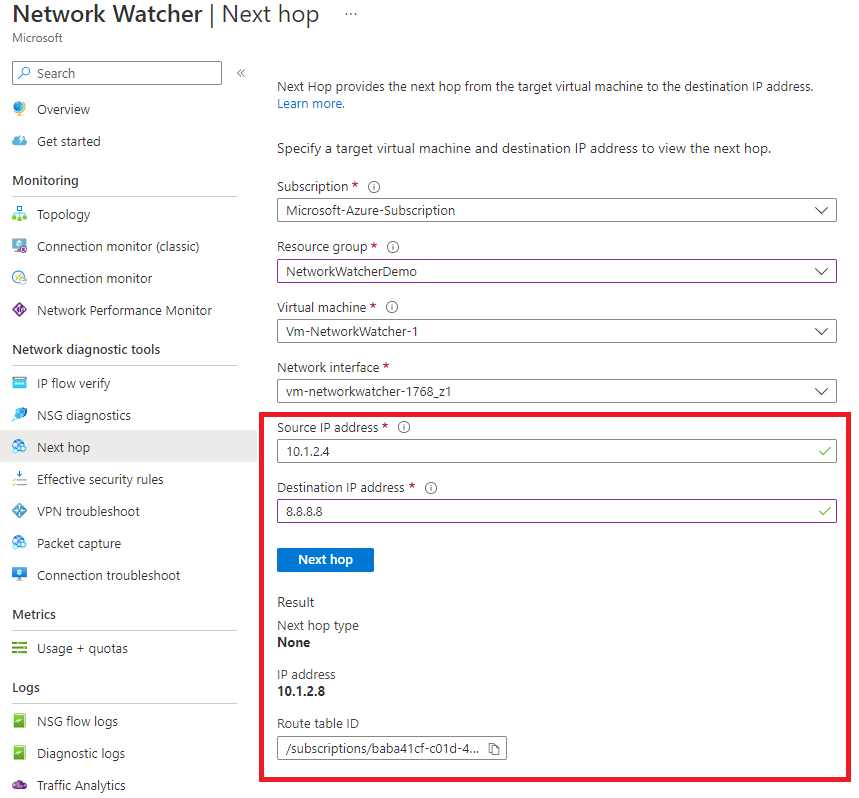
As you can see, the next hop in our example is going to 10.1.2.8, which is our virtual network appliance, although the next hop type appears to be incorrect, as it should be showing a virtual network appliance instead of none. You will also be provided with the resource Id of the route table resource, allowing you to troubleshoot further if necessary.
Effective security rules
Another handy tool which again covers NSG troubleshooting. This tool is straightforward to use. Submit a virtual machine and select the correct interface card, and it will provide you with a list of NSGs associated with that VM and NIC.
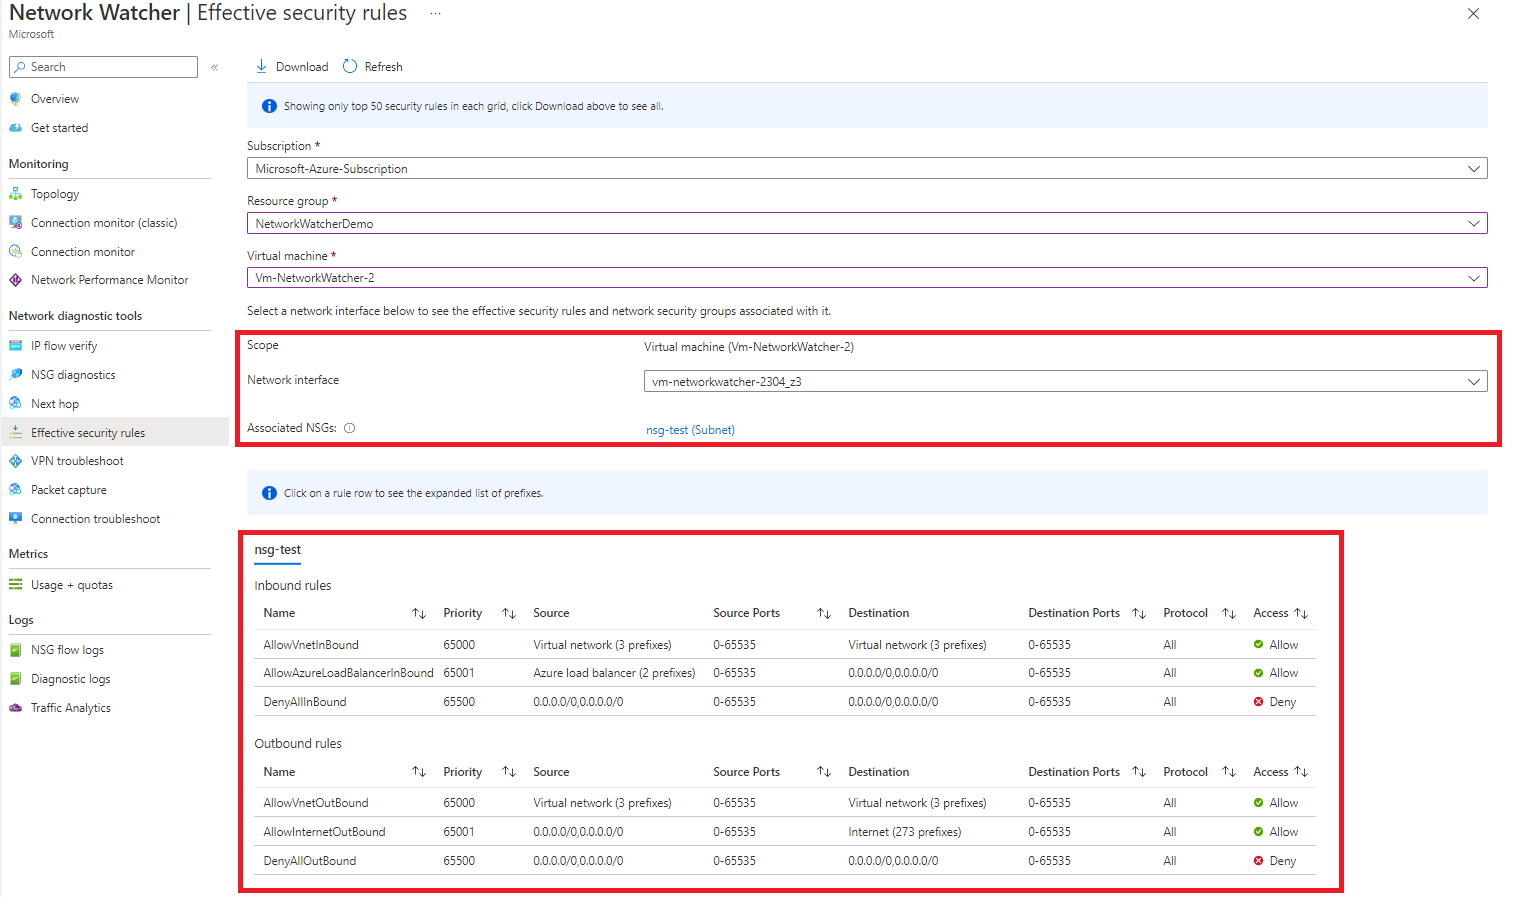
This is especially useful when looking to see where NSGs are applied at. Network security groups can be used at the subnet in the virtual network or directly to network interface cards. This tool will show you where the NSGs are associated and what rules apply.
VPN troubleshoot
Network Watcher provides the capability to troubleshoot gateways and connections. Network Watcher diagnoses the gateway's or connection's health and returns the appropriate results. The request is a long-running transaction. The results are returned once the diagnosis is complete. More information can be found here: https://learn.microsoft.com/en-us/azure/network-watcher/network-watcher-troubleshoot-overview.
Packet capture
The packet capture lets you create packet capture sessions to track traffic to and from a virtual machine. Packet capture helps to diagnose network issues both reactively and proactively. This can also be used in gathering network statistics, debugging client-server communications, etc.
Packet capture is an extension that is remotely started through Network Watcher. This capability eases the burden of running a packet capture manually on the desired virtual machine, or Virtual Machine Scale Sets instance/(s), which saves valuable time.
The step is to click click add.
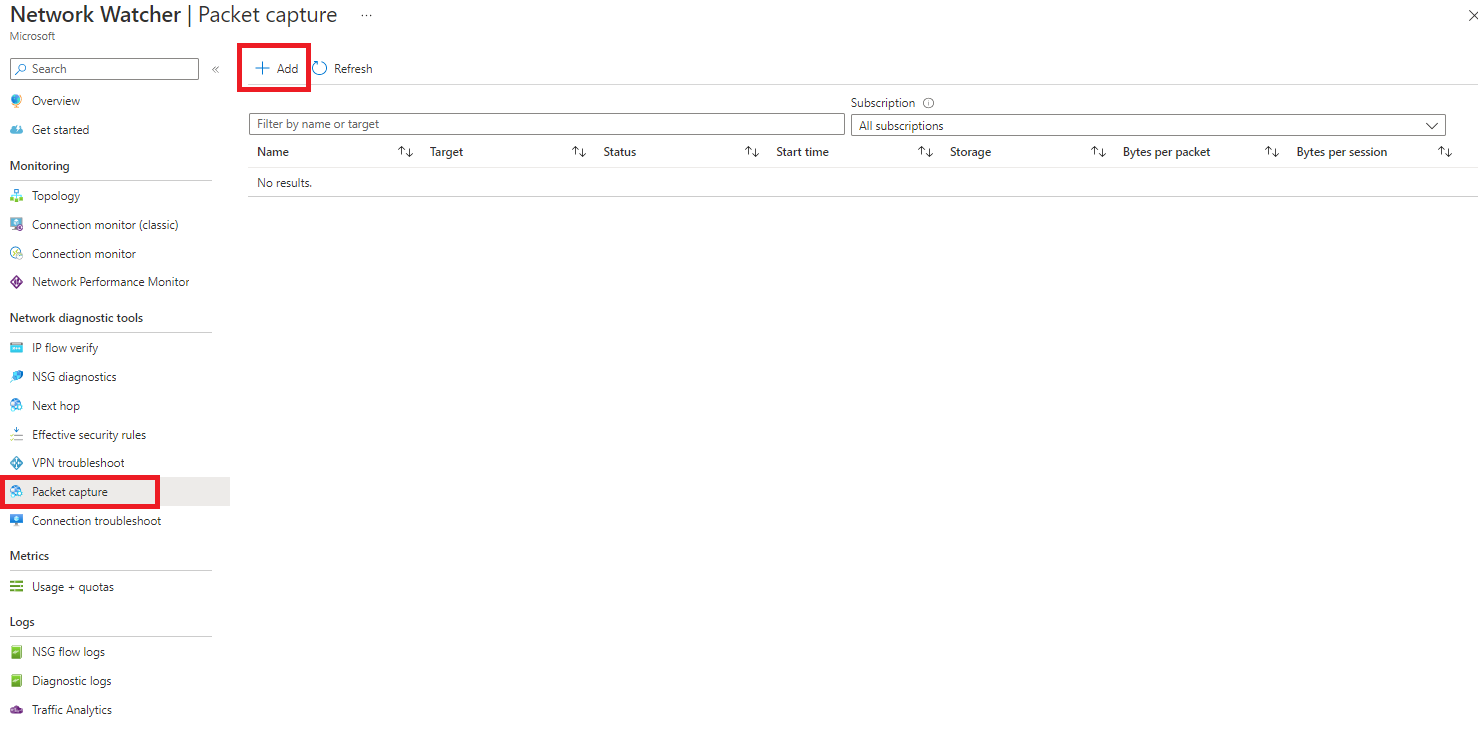
You will need to provide additional information for the packet capture, including the VM used for the packet capture session, the name of the packet capture, and where you will store the .cap outputted file. In our example, we will keep the file in a storage account, but this file can be stored on the local VM.
Optionally you are provided with the option to do additional filtering if you are looking for specific traffic. We won't have any filters configured, meaning all traffic will be captured. Select create packet capture when ready.
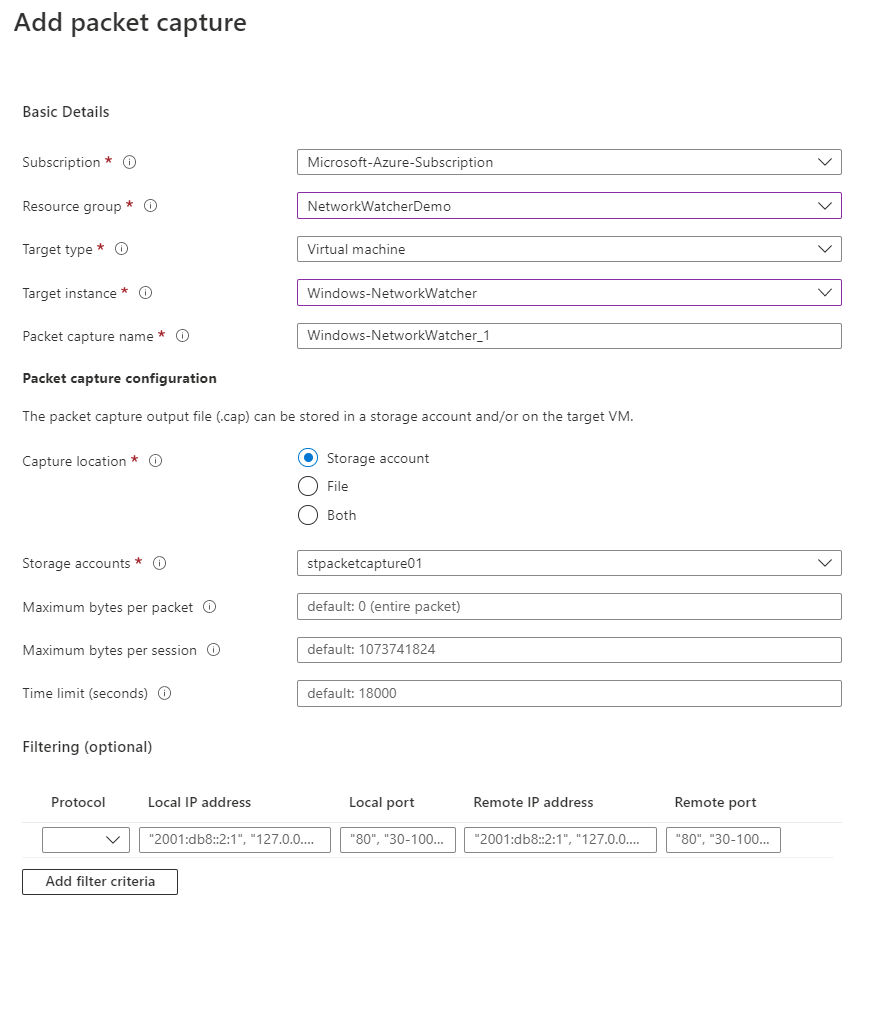
Packet capture will begin in a starting state but will run after a few minutes. When you are happy you have captured the traffic required, you can stop the capture.
Once the capture has stopped, the packet capture file will be stored locally on the VM or in a storage account. You can't view the file when packet capture is running. In our example, we captured it to a storage account.
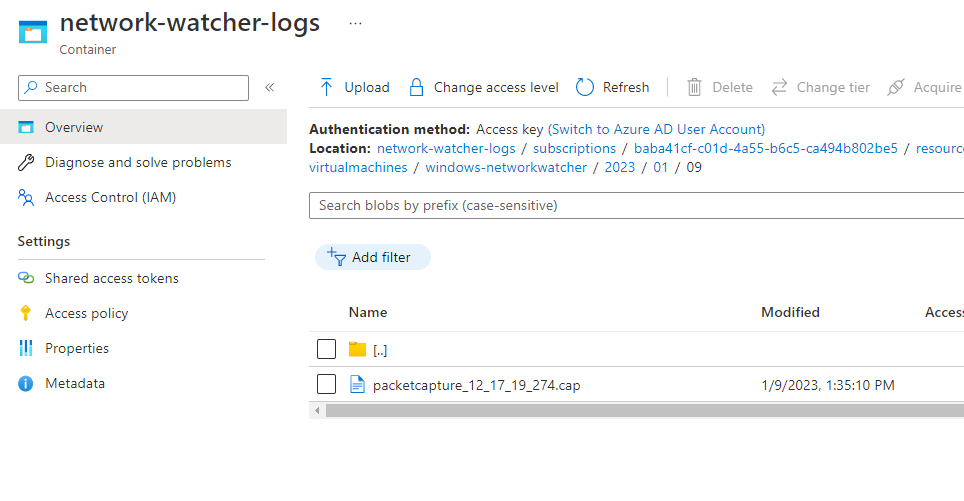
After downloading the file, you need to use a supported application to open the .cap file. Most people will use Wireshark. When opening Wireshark, go to file > open, and select the packet capture file.
This will allow you to look at the captured traffic and inspect it further. Below is an example of filtering for DNS traffic using the packet capture file.

Connection troubleshoot
The connection troubleshoot tool provides the capability to check TCP or ICP connections from a virtual machine, application gateway, or bastion to another virtual machine, URI, FQDN or IP address.
The results can provide insights into whether a connectivity issue is due to a platform or a user configuration issue. An example can be found below.
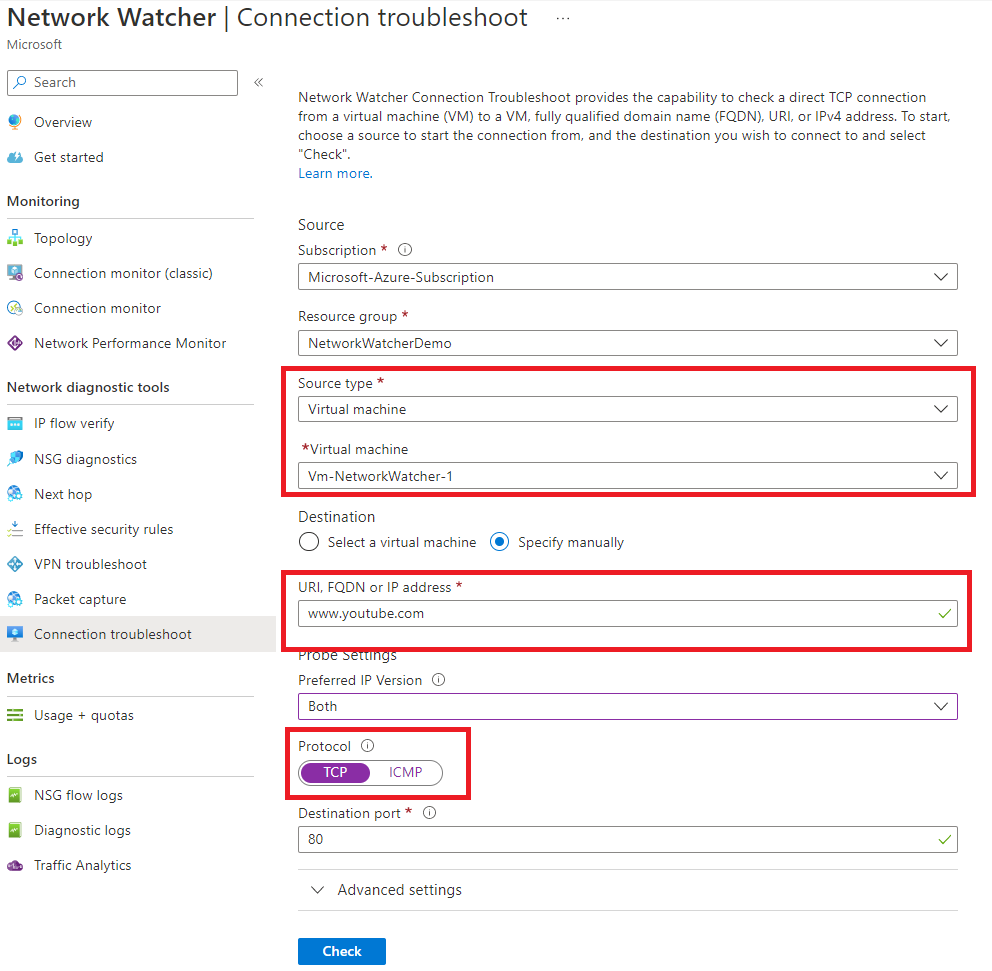
Clicking the check button will start the connectivity check, and you will be provided with helpful information once the review has been completed.
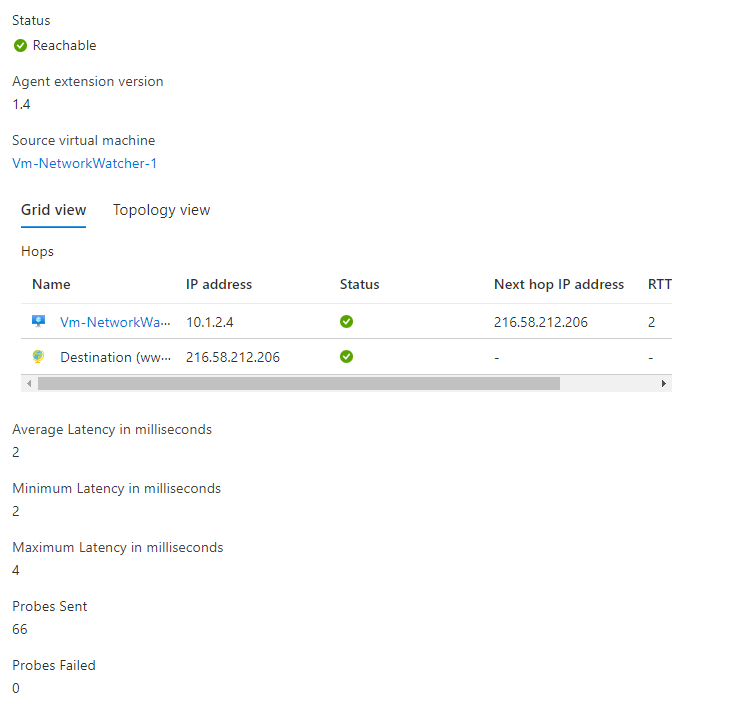
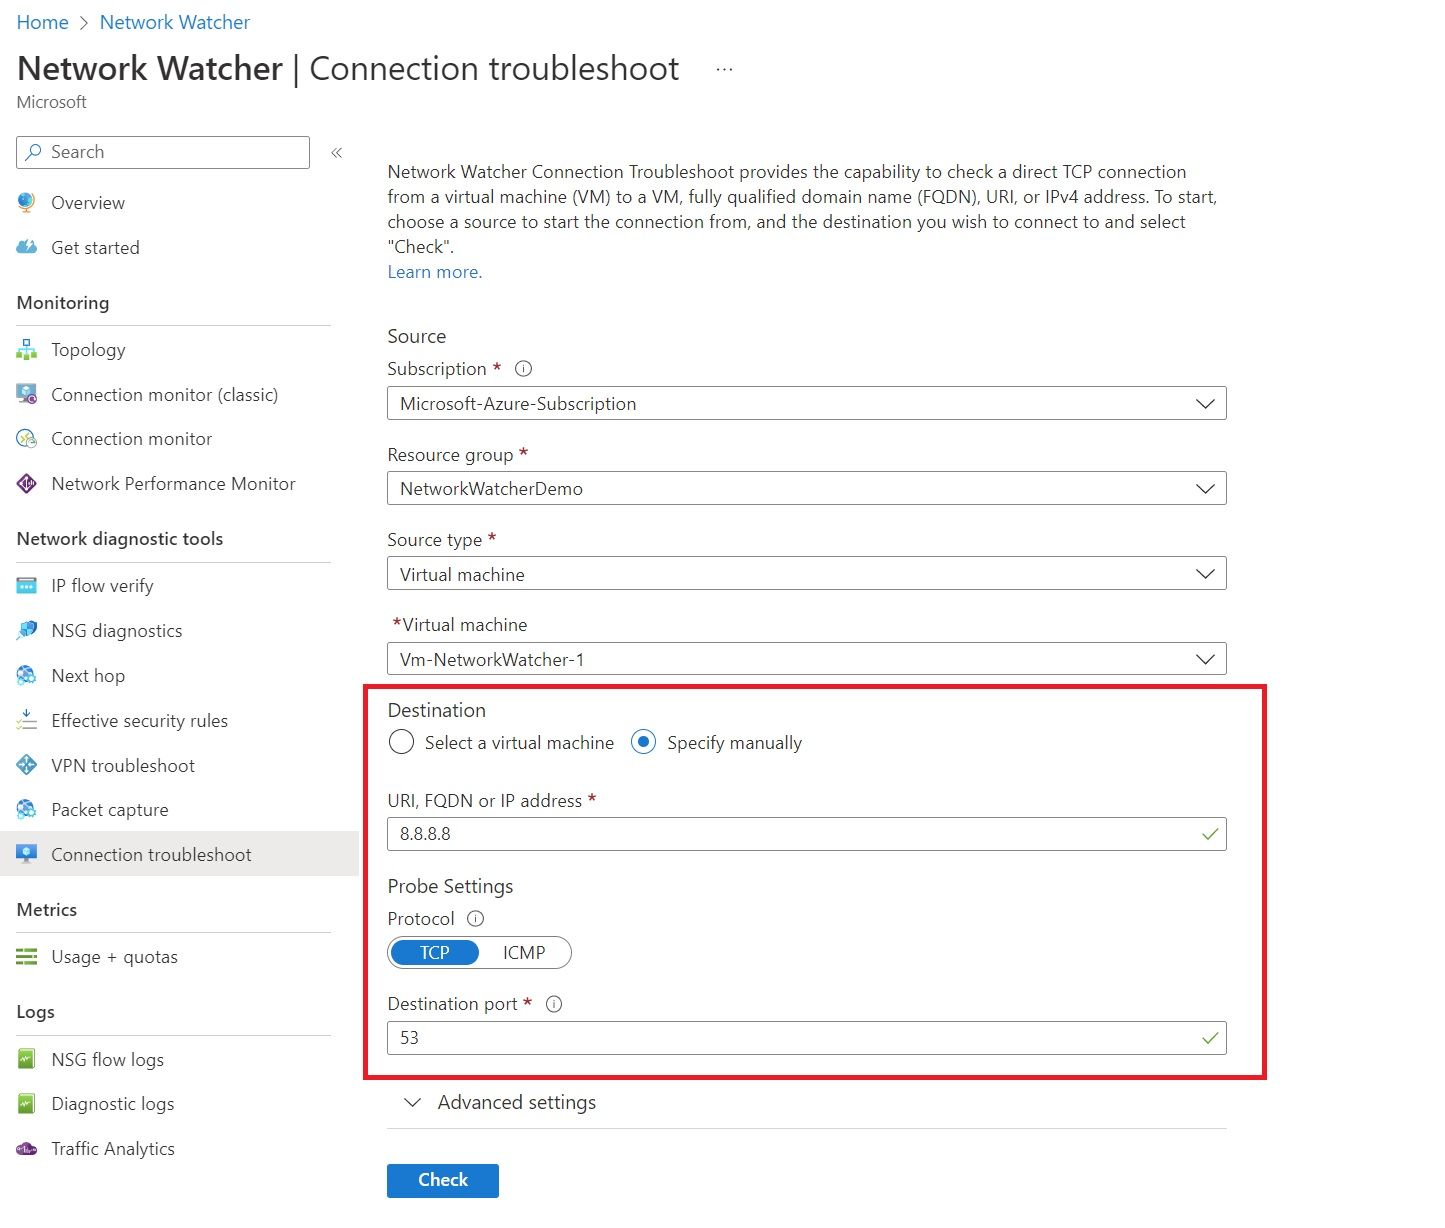
If we block traffic to 8.8.8.8 through an NSG and rerun the connection troubleshoot, we now have the destination set to 8.8.8.8 and port 53.
Traffic Analytics
Traffic analytics is a solution that provides visibility into activity in your virtual networks. Specifically, traffic analytics analyses Azure Network Watcher network security group flow logs to provide insights into traffic flow in Azure.
We've enabled flow logs on NSGs based in UK South. This can be seen below.
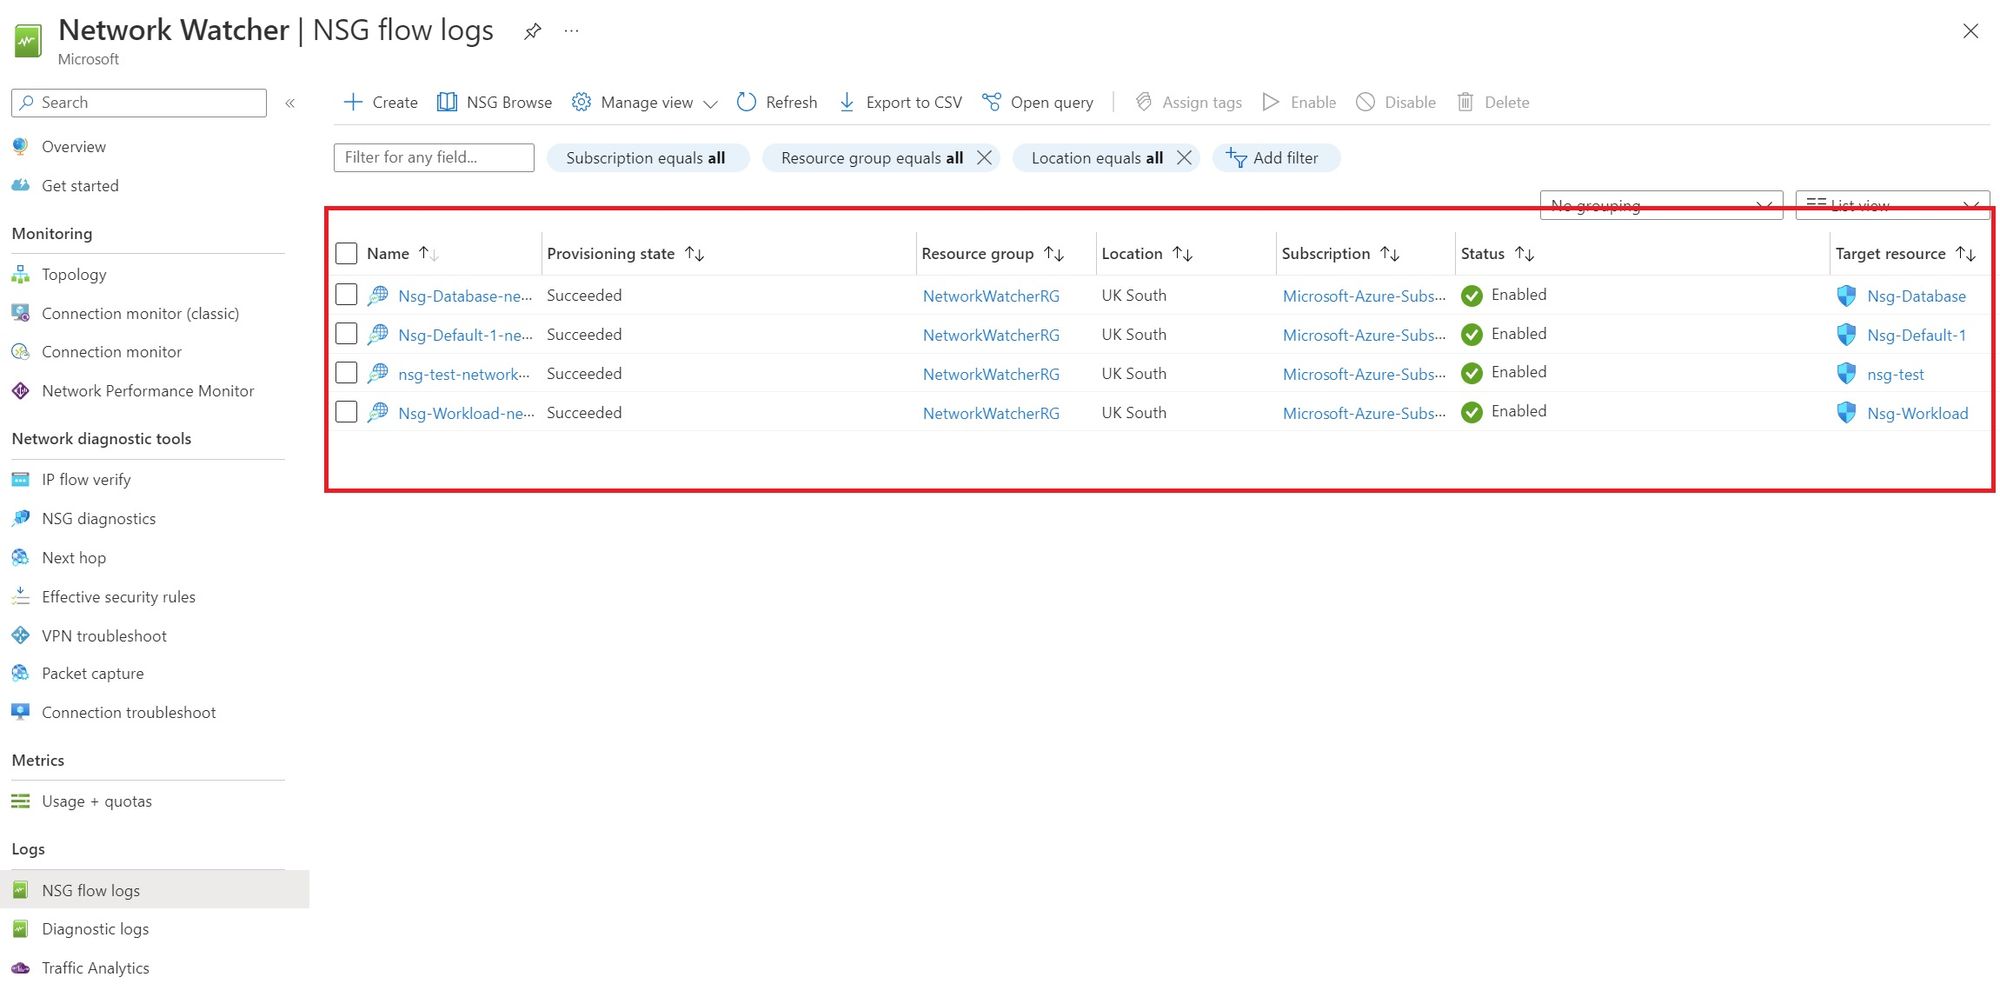
To enable flow logs, select create and go through the configuration process.
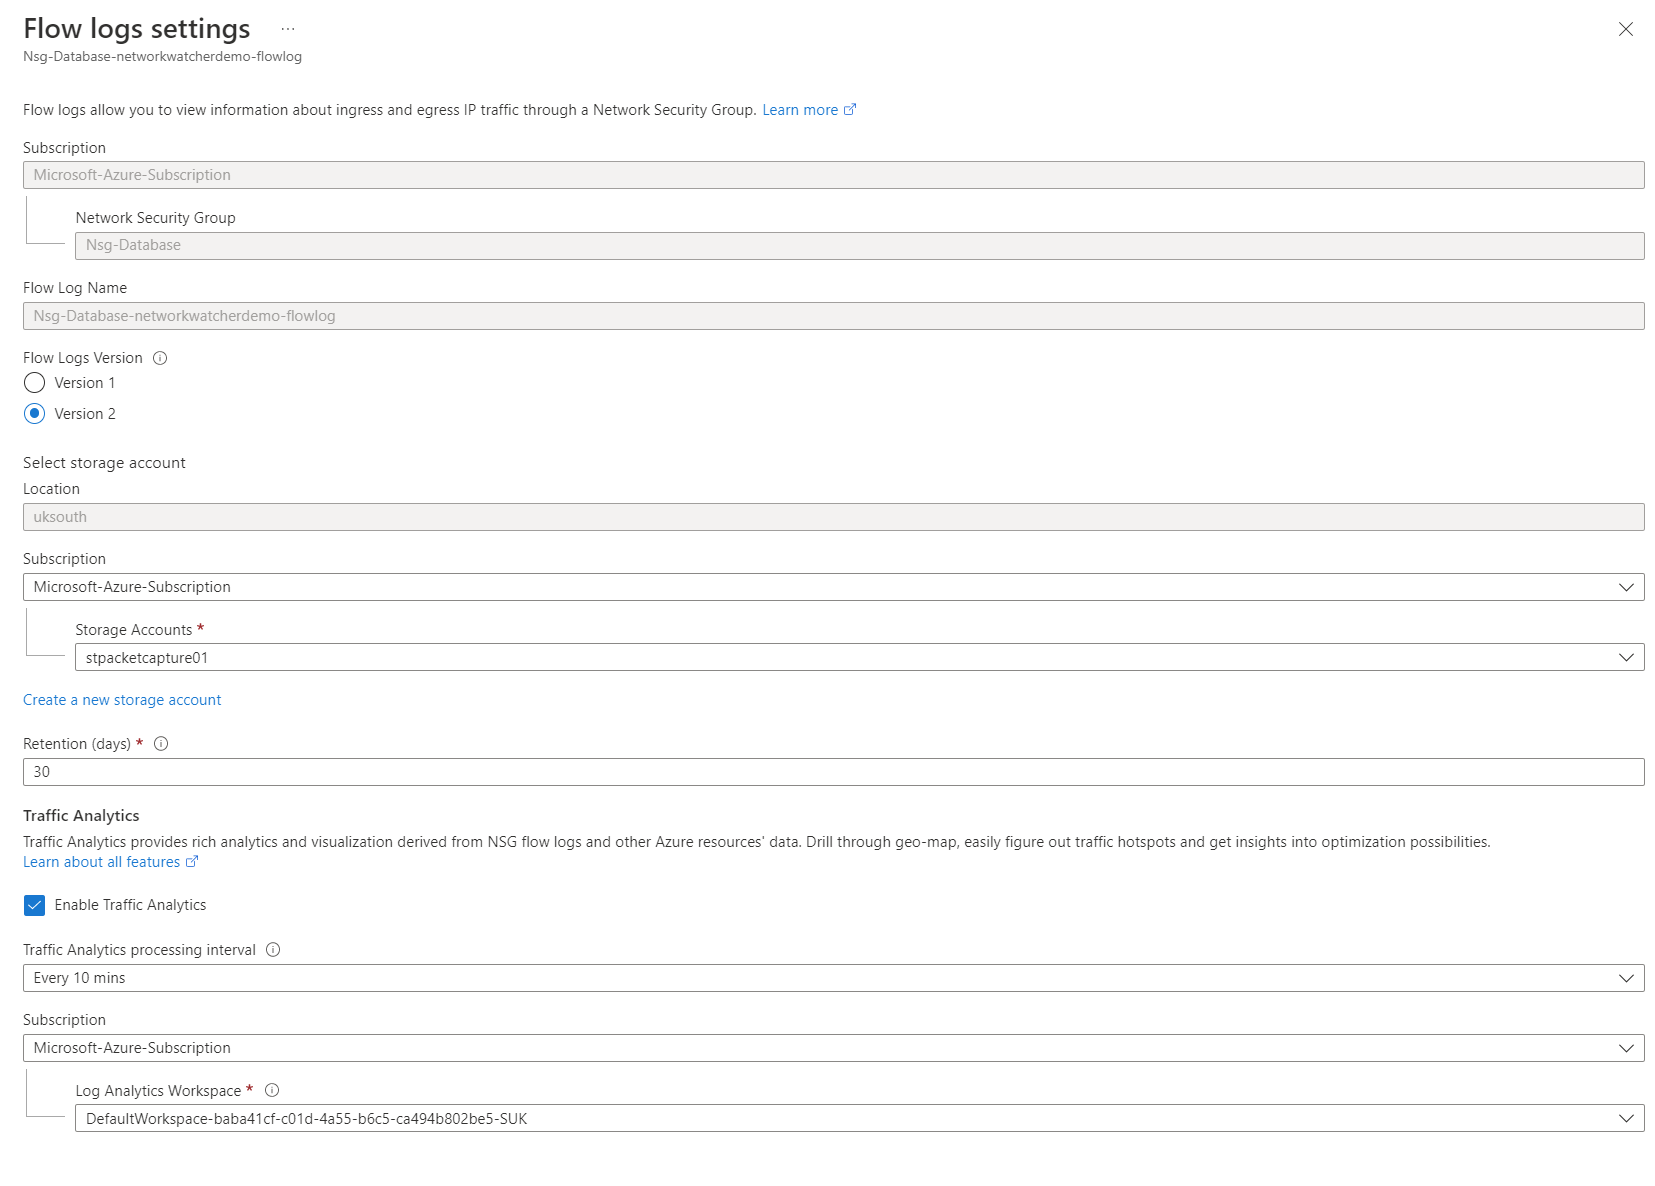
You are first asked which Flow Logs version you should use within the configuration. Version 1 and version 2 are supported. However, version 2 provides more functionality and is recommended.
The flow logs are written to an Azure Storage account, which can be further processed, analysed, queried, or exported as needed. Logs are stored in JSON. An example can be found below.
{
    "records": [
        {
            "time": "2018-11-13T12:00:35.3899262Z",
            "systemId": "a0fca5ce-022c-47b1-9735-89943b42f2fa",
            "category": "NetworkSecurityGroupFlowEvent",
            "resourceId": "/SUBSCRIPTIONS/00000000-0000-0000-0000-000000000000/RESOURCEGROUPS/FABRIKAMRG/PROVIDERS/MICROSOFT.NETWORK/NETWORKSECURITYGROUPS/FABRIAKMVM1-NSG",
            "operationName": "NetworkSecurityGroupFlowEvents",
            "properties": {
                "Version": 2,
                "flows": [
                    {
                        "rule": "DefaultRule_DenyAllInBound",
                        "flows": [
                            {
                                "mac": "000D3AF87856",
                                "flowTuples": [
                                    "1542110402,94.102.49.190,10.5.16.4,28746,443,U,I,D,B,,,,",
                                    "1542110424,176.119.4.10,10.5.16.4,56509,59336,T,I,D,B,,,,",
                                    "1542110432,167.99.86.8,10.5.16.4,48495,8088,T,I,D,B,,,,"
                                ]
                            }
                        ]
                    },
                    {
                        "rule": "DefaultRule_AllowInternetOutBound",
                        "flows": [
                            {
                                "mac": "000D3AF87856",
                                "flowTuples": [
                                    "1542110377,10.5.16.4,13.67.143.118,59831,443,T,O,A,B,,,,",
                                    "1542110379,10.5.16.4,13.67.143.117,59932,443,T,O,A,E,1,66,1,66",
                                    "1542110379,10.5.16.4,13.67.143.115,44931,443,T,O,A,C,30,16978,24,14008",
                                    "1542110406,10.5.16.4,40.71.12.225,59929,443,T,O,A,E,15,8489,12,7054"
                                ]
                            }
                        ]
                    }
                ]
            }
        },
        {
            "time": "2018-11-13T12:01:35.3918317Z",
            "systemId": "a0fca5ce-022c-47b1-9735-89943b42f2fa",
            "category": "NetworkSecurityGroupFlowEvent",
            "resourceId": "/SUBSCRIPTIONS/00000000-0000-0000-0000-000000000000/RESOURCEGROUPS/FABRIKAMRG/PROVIDERS/MICROSOFT.NETWORK/NETWORKSECURITYGROUPS/FABRIAKMVM1-NSG",
            "operationName": "NetworkSecurityGroupFlowEvents",
            "properties": {
                "Version": 2,
                "flows": [
                    {
                        "rule": "DefaultRule_DenyAllInBound",
                        "flows": [
                            {
                                "mac": "000D3AF87856",
                                "flowTuples": [
                                    "1542110437,125.64.94.197,10.5.16.4,59752,18264,T,I,D,B,,,,",
                                    "1542110475,80.211.72.221,10.5.16.4,37433,8088,T,I,D,B,,,,",
                                    "1542110487,46.101.199.124,10.5.16.4,60577,8088,T,I,D,B,,,,",
                                    "1542110490,176.119.4.30,10.5.16.4,57067,52801,T,I,D,B,,,,"
                                ]
                            }
                        ]
                    }
                ]
            }
        }
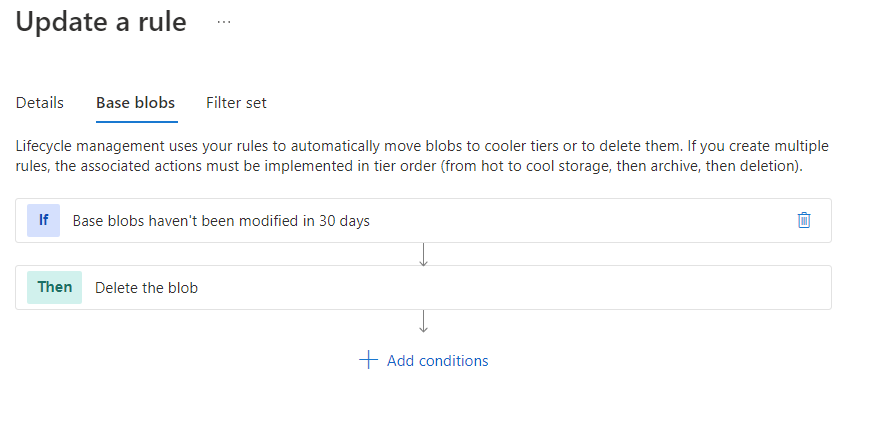
Retention in days can also be used for V2 storage accounts, allowing you to delete flow log data when the retention day comes up. This is done through the lifecycle management feature for V2 storage accounts. The rule is automatically created on the storage account when you enable flow logs.
Finally, the last setting to enable is traffic analytics as part of the flow log.
Traffic analytics provides you with visibility into your virtual networks, allowing you to monitor and view essential insights, such as:
- Who is connecting to the network?
- Where are they connecting from?
- Which ports are open to the internet?
- What's the expected network behaviour?
- Is there any irregular network behaviour?
- Are there any sudden rises in traffic?
After analysing the NSG flow logs, traffic analytics combines the log data with security, topology, and geography intelligence. It reduces the log volume by aggregating flows with a common source IP address, destination IP address, destination port, and protocol and then stored in a Log Analytics workspace.
After enabling traffic analytics, it says it may take 20-30 minutes before the data shows up. This took much longer in my scenario. I believe this is because I only have a limited number of virtual machines running.
Traffic analytics won't provide much insightful data for those VMs, and they don't make many internal or external connections.
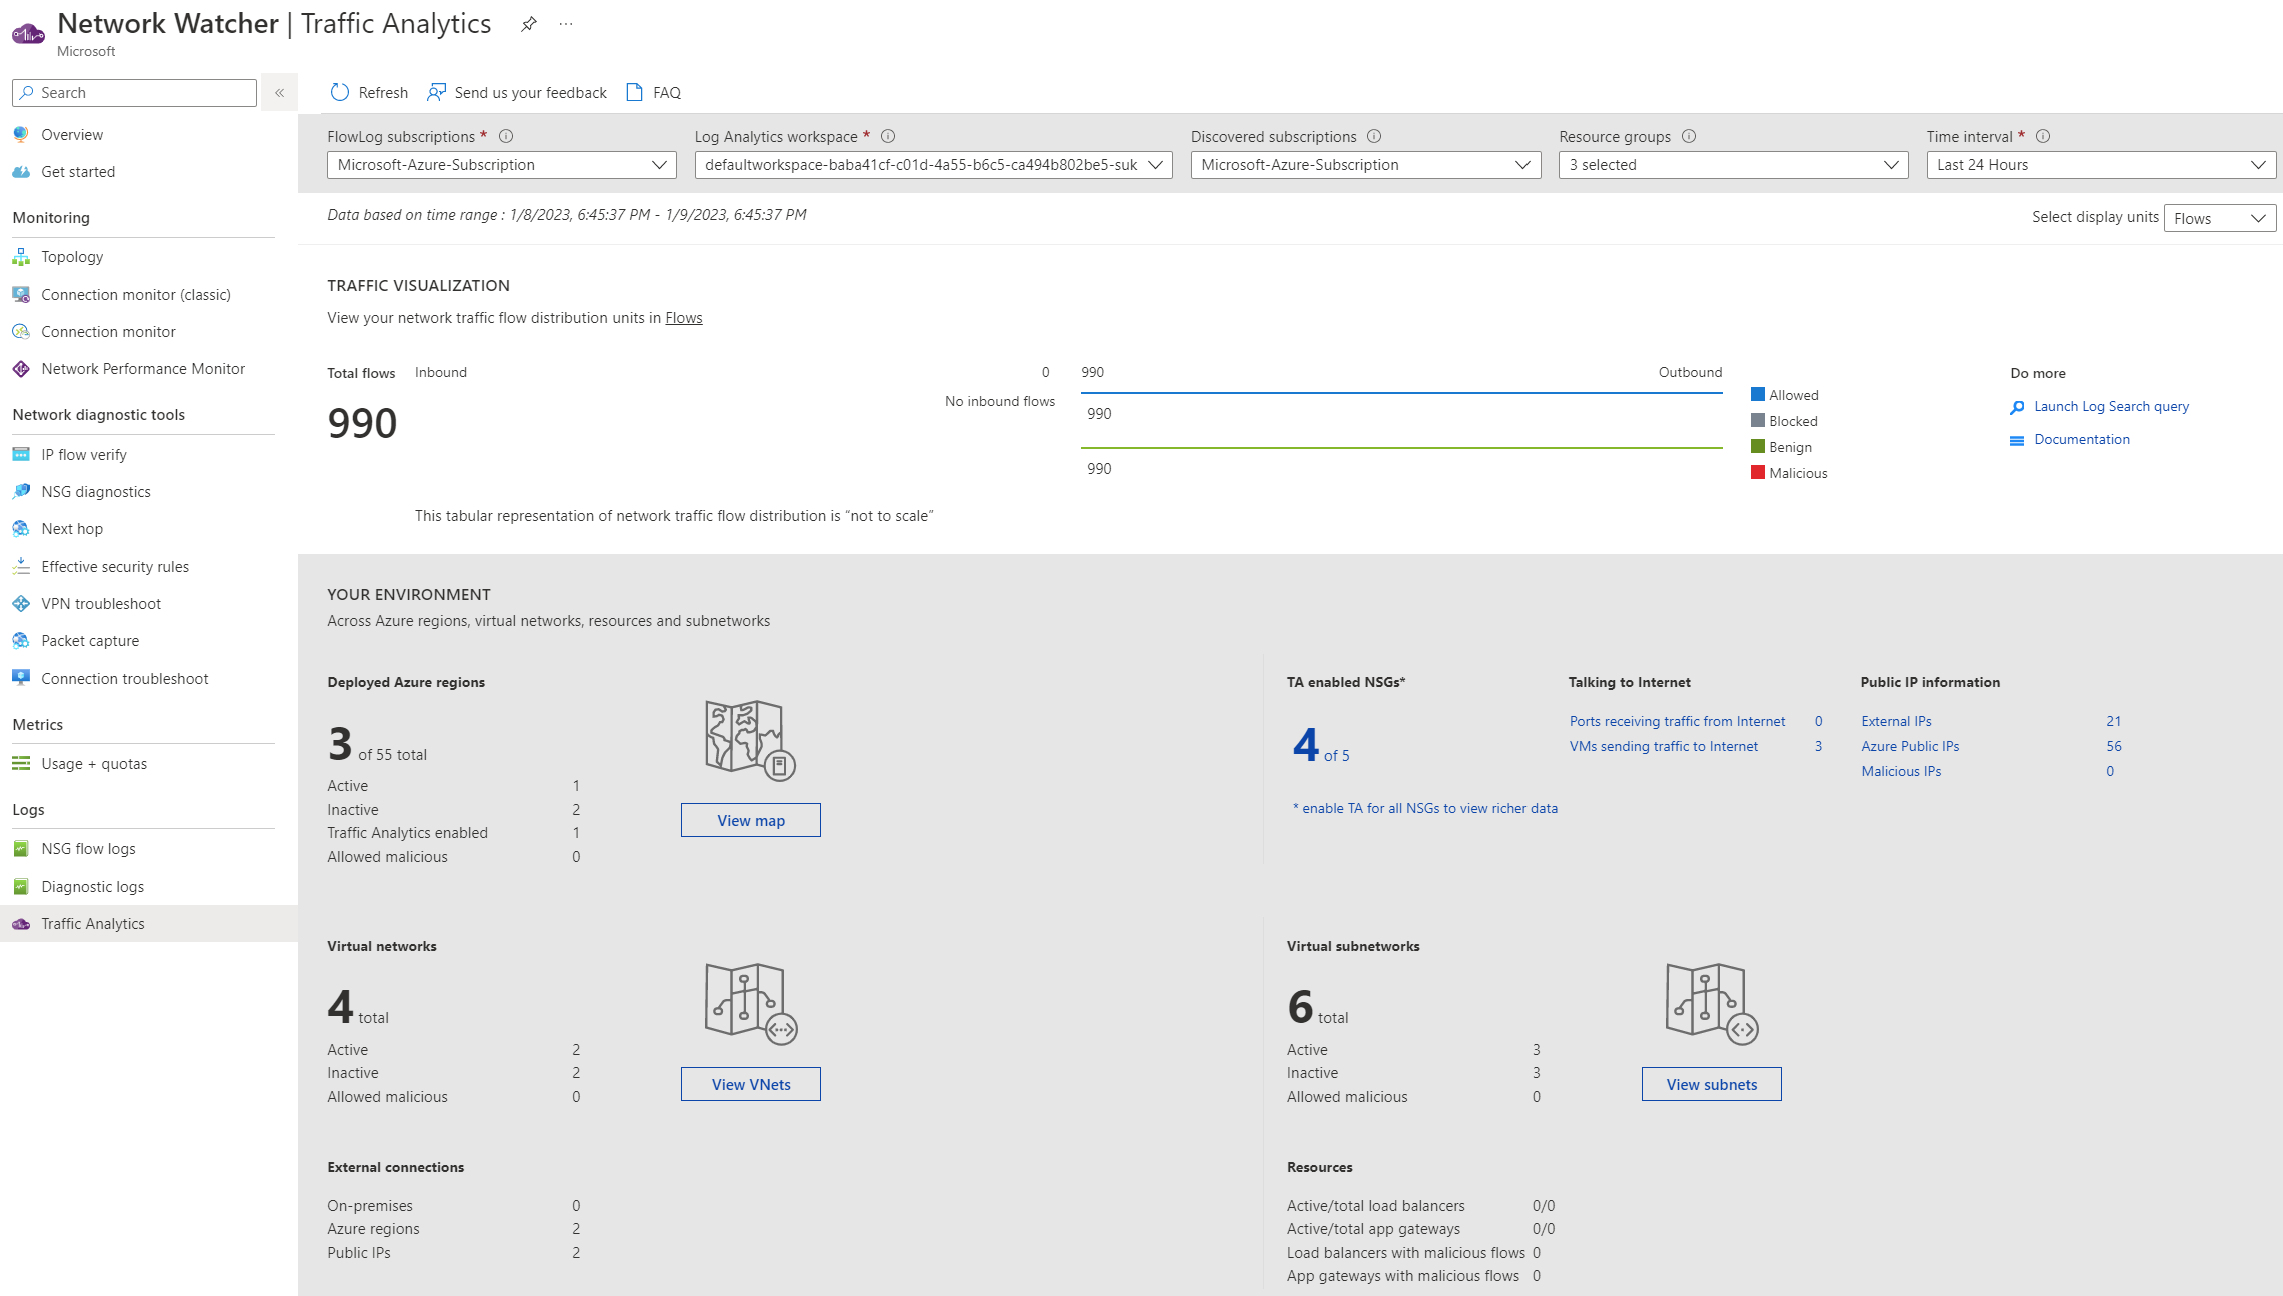
As you can see above, I'm already being provided with helpful information. I've had 990 connections going outbound successfully, which are allowed through NSGs. This data would be much more practical in a production organisation.
The data being visualised is being stored in a Log Analytics Workspace. The two tables used are AzureNetworkAnalytics_CL and AzureNetworkAnalyticsIPDetails_CL.
An example of using KQL to query the workspace can be found below. This query returns helpful information about public IP addresses detected through Flow Logs.
AzureNetworkAnalyticsIPDetails_CL
| where SubType_s == 'FlowLog' and FlowType_s == 'AzurePublic'
| distinct IP_s, PublicIPDetails_s, Location_s, FlowIntervalStartTime_t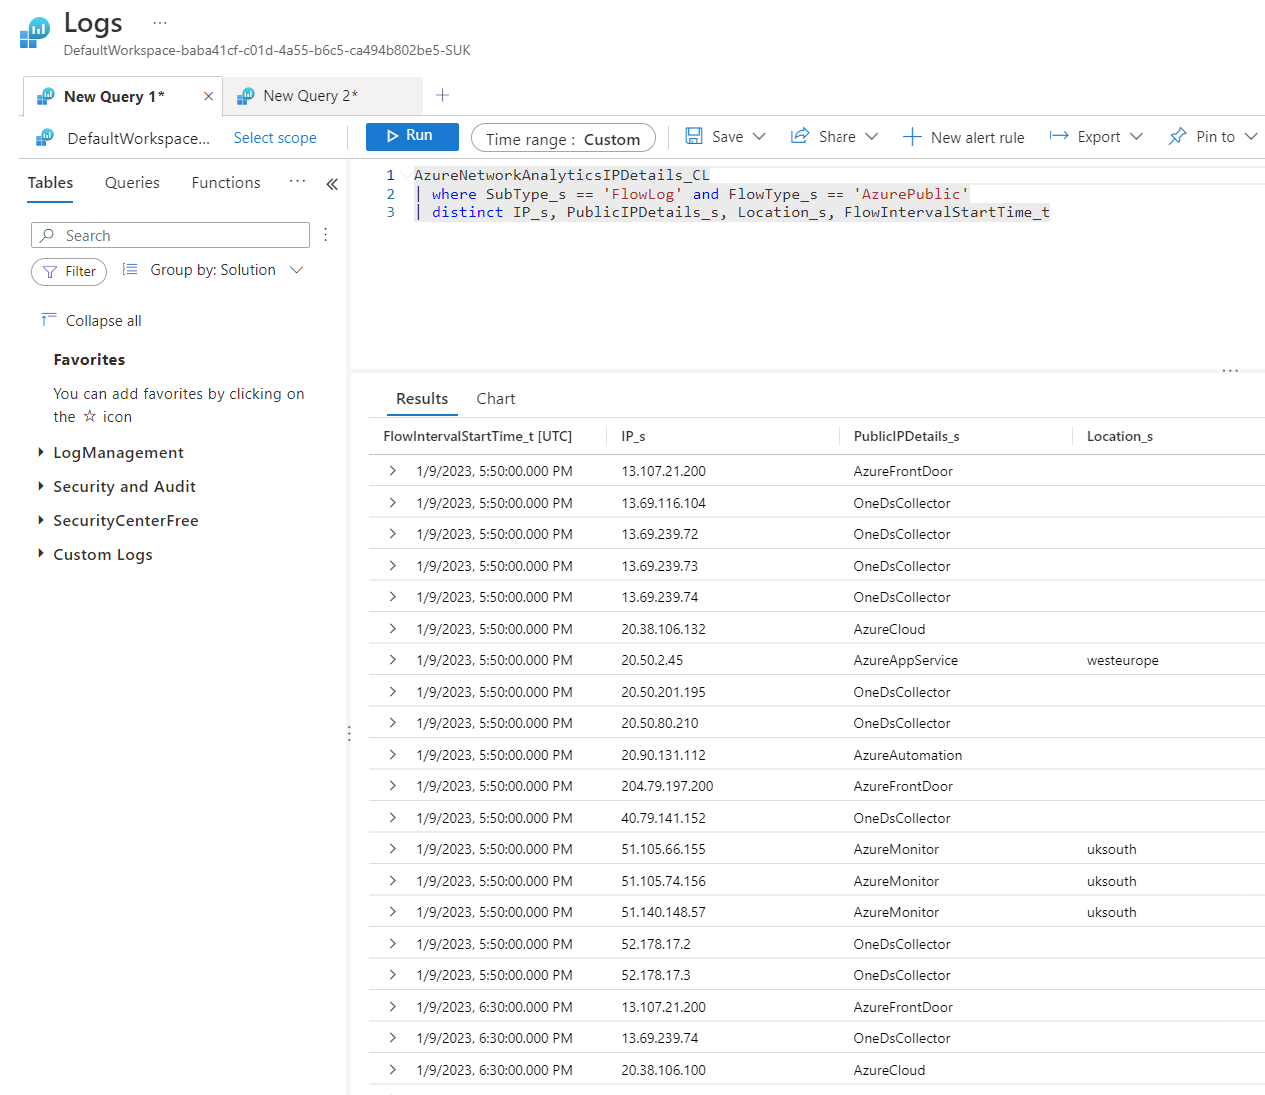
That's a wrap! Thanks for reading this blog, and congratulations if you got this far. Please let me know if something is incorrect or if you have any improvements. If you have any questions, please let me know.
Please connect with me below.